| Back to Index |
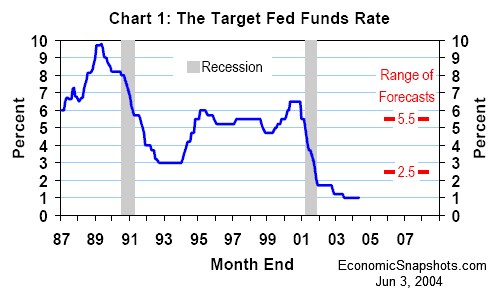
June 3, 2004 – The next stage in the FOMC’s policy “program” will be to wean the economy from a large dose of monetary policy stimulus. The current plan is to gradually raise the Fed funds target (currently 1%, Chart 1) to a “neutral” level.
The FOMC has signaled its intention to start tightening soon – probably at its next policy meeting on June 29 & 30. One complication raised by this strategy is that no one knows exactly where the neutral Fed funds rate lies.
FOMC members have been clear on two points: 1) They are very sure that the neutral Fed funds rate is greater than 1%; 2) They will be relying heavily on the economic data for guidance.
According to a Bloomberg poll of economists at the Fed’s 23 primary dealers, the mean estimate of the neutral Fed funds rate is about 4%, with estimates ranging from 2.5% to 5.5%.[1] 8 of the 18 respondents expect the Fed funds rate to reach neutral by the end of 2005. 10 think it will take longer.
The FOMC works with a nominal Fed funds target. But, according to economic theory, the economy reacts to the real Fed funds rate. “Neutral” refers to the real Fed funds rate that would keep real GDP equal to its potential (or “full employment”) level, in the absence of any temporary shocks to supply or demand. Economic theory tells us that meeting this GDP condition will ensure the maximum level of employment consistent with price stability – the FOMC’s policy mandate.
It can be shown in theory that the neutral real Fed funds rate should rise and fall with the rate of growth in potential real GDP. It may also vary with other long- run economic developments (such as shifting structural trends in the Federal deficit). [2]
The nominal Fed funds rate – the interest rate that is directly targeted by the FOMC – is approximately equal to the real Fed funds rate plus the expected rate of inflation. In practice, the measured inflation rate is widely used as a proxy for expected inflation. The FOMC’s preferred inflation gauge (and the one used here) is the chained price index for personal consumption expenditures excluding food & energy – a measure of “core” inflation.
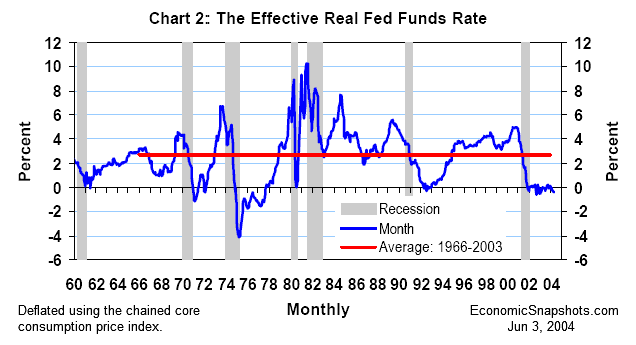
The neutral real Fed funds rate is intrinsically immeasurable. However, as reportedly noted in recent comments from Fed Governor Bernanke, long-term averages of the observed real Fed funds rate can offer a rough guide. [3]
Using the time period selected by Bernanke, the real Fed funds rate averaged 2.7% from January 1966 through December 2003 (Chart 2). Is this historical average a reasonable guide to the neutral real Fed funds rate today?
Some Fed watchers have argued that the average real Fed funds rate for the “low inflation” era of the 1950’s and 1960’s yields a better approximation of current monetary policy conditions. One serious drawback here is that the Fed funds market was not widely used until the mid 1960’s. Before that point, the Fed funds rate was not viewed as a meaningful monetary policy indicator. [4] Although older data are available for the Fed funds rate, the earliest relevant history starts in about 1966.
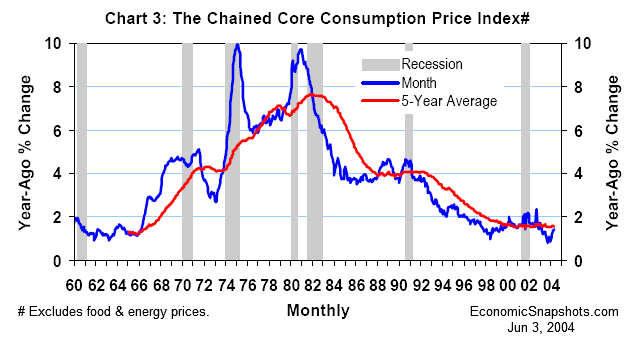
Unless monetary policy was actually neutral for the time period chosen, no simple historical average will yield a reasonable estimate of the neutral real Fed funds rate. Based on the economy’s long-run inflation track record – the litmus test of monetary policy – this qualification rules out most of U.S. history (Chart 3.).
Keeping in mind those long and variable monetary policy lags, the rising inflation trend seen from 1966 through the early 1980’s suggests that the real Fed funds rate was probably below neutral, on average, for most of the 1960’s and 1970’s. The declining inflation trend that surfaced after the 1981-82 recession suggests that the real Fed funds rate was probably above neutral, on average, for most of the last two decades.
For the whole period from 1966-2003, one can argue that these broad deviations from neutral monetary policy should roughly cancel out, on average. However, those who would pick and choose among sub-periods of this time span are on shakier ground, because monetary policy was probably not neutral then.
All else the same, economic theory suggests that the neutral real Fed funds rate should follow a time path similar to potential real GDP growth. And, the evidence of shifting trends in potential real GDP growth over the last 4 decades suggests that the neutral real Fed funds rate has been a moving target (Chart 4).
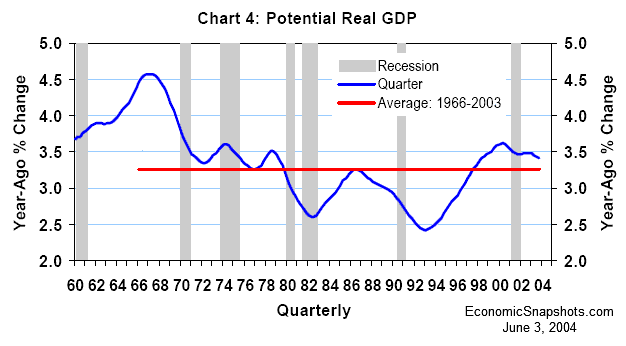
There is general agreement on the broad historical path of potential real GDP growth (which is also intrinsically immeasurable), but specific estimates vary. According to the Congressional Budget Office (CBO), potential real GDP rose by 3.4% in 2003 (measured Q4/Q4) – quite close to its 3.3% average annualized gain from 1966-2003. This suggests that today’s neutral real Fed funds rate should also be close to its 2.7% historical average.
However, to the extent that FOMC members believe that potential real GDP is currently growing faster/slower than average, they are likely to favor a higher/lower estimate of the neutral real Fed funds rate. For example, former San Francisco Fed President Parry (known for his bullish views on potential GDP) recently said that the neutral real Fed funds rate might be as high as 3.5%. [5] (Parry retired last month.)
Assuming a neutral real Fed funds rate of about 2.7%, the neutral nominal Fed funds rate will be driven by the outlook for inflation.
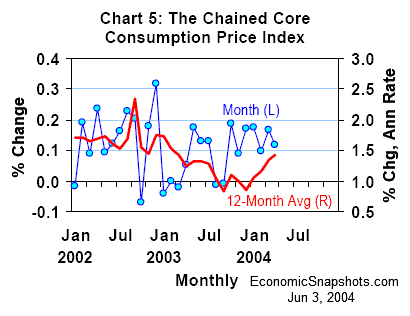
The chained core consumption price index rose by 1.4% in the 12 months through April (Chart 5). In the monthly data, however, core inflation has accelerated a bit this year, averaging a 1.7% annual rate for the first four months.
Thus, to the extent that one expects future inflation to match the recent past, a rough range for the neutral nominal Fed funds rate would be 4% to 4.5%. [6] That amounts to about the consensus forecast, or a bit higher.
There are 5 more FOMC meetings scheduled this year, and another 8 next year. If the FOMC were to raise its Fed funds target by 25 basis points at each of these meetings, the Fed funds target would reach 4.25% by December 2005 – roughly neutral by these calculations. This qualifies as one possible path for a steady-but-gradual transition to neutral monetary policy. We don’t know the FOMC’s exact timing plans.
The FOMC majority’s current position (as of the May FOMC statement) is that “slack resource use” will keep pricing conditions competitive enough to keep inflation subdued – allowing the FOMC enough time to move gradually to a less inflationary policy stance. But, the current combination of strong economic growth, rising input costs and “easy” monetary policy is a potentially volatile one. If the FOMC finds any cause to become more nervous about the inflation outlook than they are now, there is a good chance they will tighten faster (and, perhaps, further) than they currently anticipate.
Suzanne Rizzo