| Back to Index |
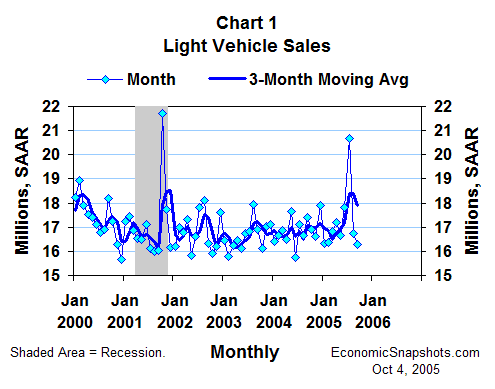
October 4, 2005 – Based on reports from the auto makers, U.S. car and light truck sales fell by about 0.5M units in September to an estimated 16.3M unit annual rate. This followed a much larger 3.9M unit August decline (Chart 1).

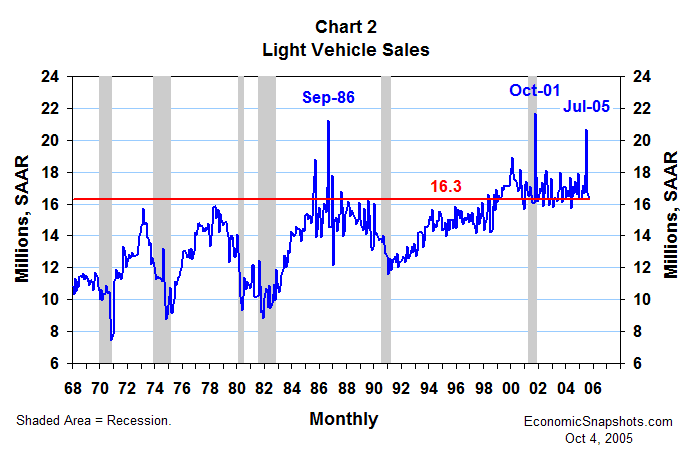
A new round of sales incentives (“employee discounts for everyone”) sent light vehicle sales soaring to a near-record 20.7M in July (Chart 2). Sales were widely expected to retrench after this unsustainable buying binge.

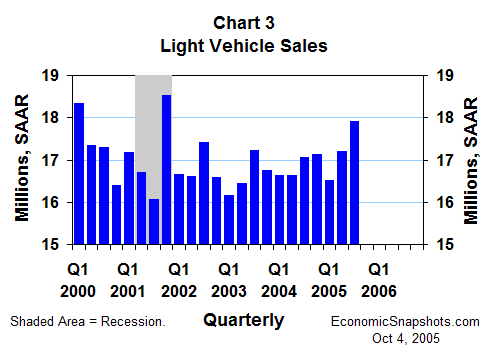
Despite the subsequent increase in gasoline prices, the collapse in consumer confidence and other disruptions caused by Hurricanes Katrina and Rita, the “payback” for those extra strong July sales seems to have been relatively small to date. Including the last two months’ declines, light vehicle sales averaged about 17.9M for Q3 as a whole – a gain of 0.7M compared to Q2, and their best quarterly showing since they reached 18.5M in Q4 2001 (Chart 3).

Bottom line: These data do not support the case for a consumer-led economic slowdown.
Suzanne Rizzo