| Back to Index |
October 14, 2005 – The U.S. Consumer Price Index (CPI) shot up by 1.2% in September, spurred by a 12% leap in consumer energy prices. This was the largest monthly increase in 25 years (Chart 1).
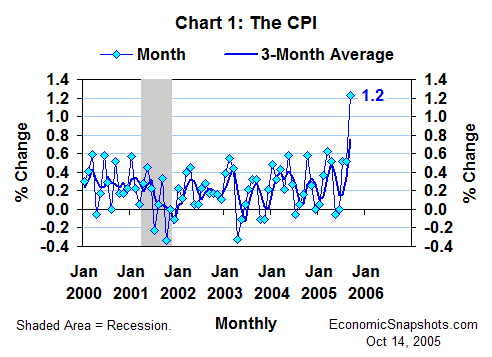
Energy prices have been pushing the CPI notably higher in each of the last three months. However, all of this extra price growth has been confined to the energy sector.
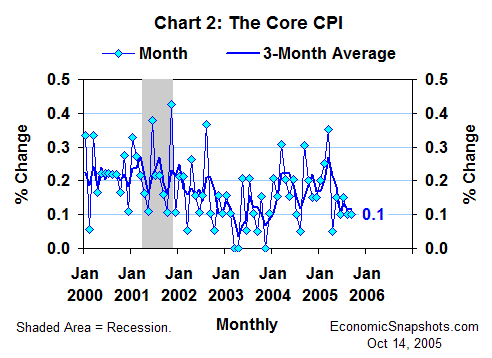
Excluding energy, the CPI rose by 0.2% in September (+0.1% in August), while the closely-watched core CPI (excluding food and energy) edged up by a meager 0.1% for the fourth straight month (Chart 2).
In the bigger picture, the CPI rose by 4.7% in the twelve months through September, accelerating from the 3% trend that prevailed earlier this year (Chart 3).
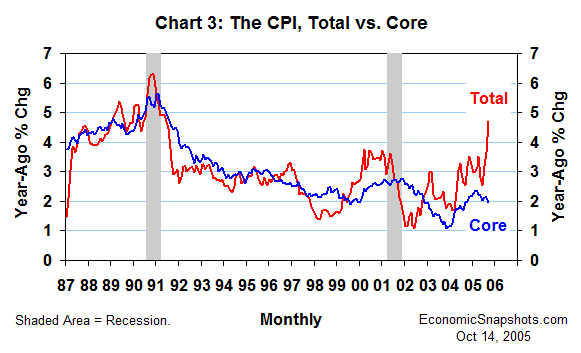
In contrast, the core CPI rose by only 2% over the last twelve months, and it has been on a relatively steady trend since early 2004.
As reconfirmed by the minutes of the September FOMC meeting (released earlier this week), the FOMC won’t react to rising energy prices unless they seem to be causing a broadly-based acceleration in consumer price growth. The stubbornly tame trend in core CPI growth suggests that this was not the case in September.
Thus, these data favor a steady course in U.S. monetary policy – namely, another “measured” 25 basis-point increase in the target Fed funds rate at the FOMC’s next policy meeting on November 1.
Suzanne Rizzo