| Back to Index |
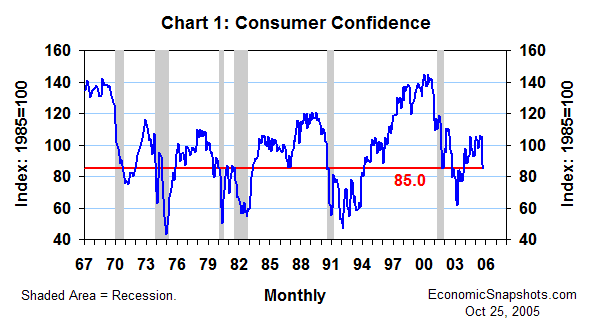
October 25, 2005 – The Conference Board’s Consumer Confidence Index edged down by 2.5 index points to 85.0 in October after an 18 point September plunge (Chart 1).

According to the Conference Board, “Much of the decline in confidence over the past two months can be attributed to the recent hurricanes, pump shock [high gasoline prices] and a weakening labor market…”
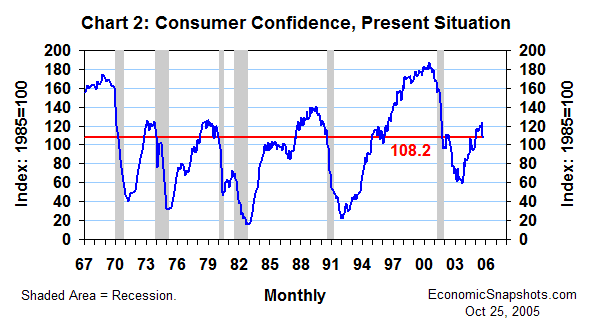
The present situation index fell by 2.2 index points to 108.2 in October. As of October, this index had fallen 15.6 index points below its August level, but it was still about 14 points higher than its level in October last year and still relatively robust by broad historical standards (Chart 2).

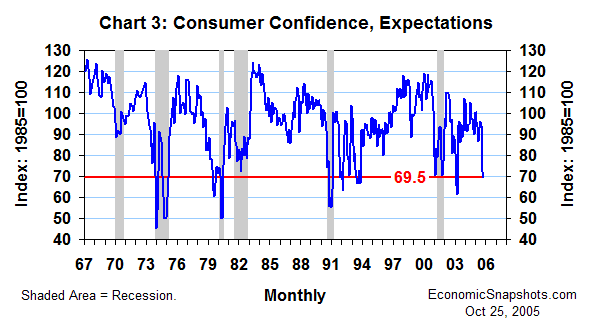
The expectations index (consumers’ forecasts for the next six months) has taken a more severe beating in the last two months – falling by nearly 24 index points to 69.5 between August and October (Chart 3). (October’s decline was 2.8 index points.)

Thus, consumers seem to be saying that economic conditions are currently ok, but they are very worried about the outlook.
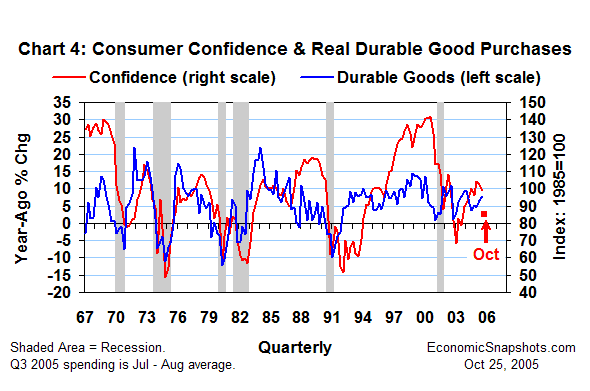
In the past, sudden sharp declines in consumer confidence have occasionally provided early warning of serious trouble on the consumption front. However, even for consumer purchases of durable goods (which are generally believed to be more sensitive than total consumption to changes in consumer confidence), there is typically quite a bit of slippage in the relationship between consumer confidence and spending (Chart 4).

Suzanne Rizzo