
| Back to Index |
October 31, 2005 – U.S. real GDP rose at a 3.8% annual rate in Q3 following a 3.3% gain in Q2. Real GDP growth averaged 3.6% for the last two quarters – as it has done since Q2 2004 (Chart 1).
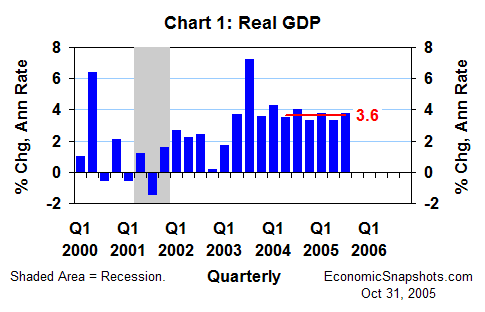
The BEA said it could not isolate the effects of Hurricanes Katrina and Rita in Q3 GDP, except in a few minor instances. If there were significant, negative hurricane effects hidden in these data, the steady overriding GDP trend suggests that they were fully offset by something else.
Real consumption rose at a 3.9% annual rate in Q3 – exceeding Q2’s 3.4% increase by a half percentage point (pp). In the Q3 consumption detail, stronger growth in sales of motor vehicles and consumer services more than offset the weakness in sales of energy goods and clothing.
Real fixed investment rose at a 5.7% annual rate in Q3 – still robust, albeit notably slower than Q2’s hefty 9.5% gain. In the real GDP total, this slowing in fixed investment growth slightly more than offset the pick up in consumption.
Real government spending rose at a 3.2% annual rate in Q3, somewhat faster than Q2's 2.5% increase.
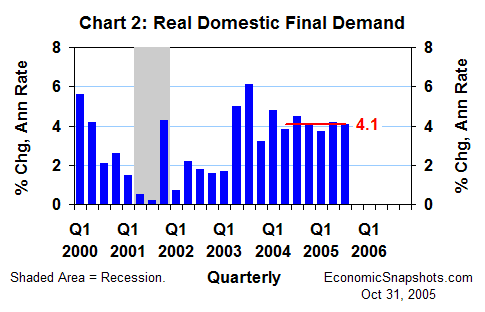
Adding these pieces together, real domestic final demand (consumption + fixed investment + government spending) rose at a 4.1% annual rate in Q3, essentially matching Q2’s 4.2% gain. Growth in these sales has been trending at just above 4% for the last six quarters (Chart 2).
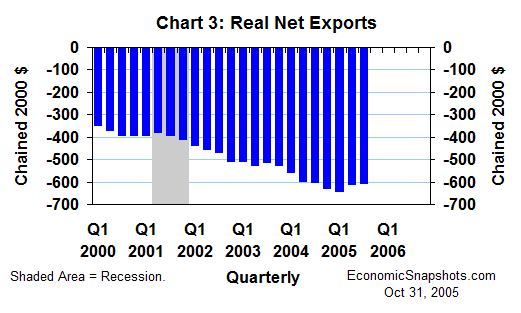
The real foreign trade balance was about unchanged in Q3 at a deficit of $611.8B (measured in chained 2000 dollars, Chart 3). Thus, foreign trade contributed essentially zero to Q3 real GDP growth. (GDP growth depends on the change in the trade balance, not its level.) In Q2, a $31.2B improvement in the real trade balance added 1.1 pp to real GDP growth.
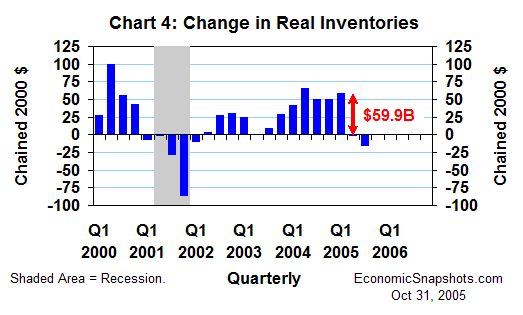
Real inventory growth fell by $14.9B to -$16.bB in Q3 (Chart 4) – trimming 0.6 pp from Q3 real GDP growth. But, in Q2, a stunning $59.9B plunge in inventory growth (from +$58.2B in Q1 to -$1.7B in Q2) reduced Q2 real GDP growth by a massive 2.1 pp. Thus, inventories’ contribution to real GDP growth rose by 1.5 pp between Q2 and Q3.
Together, inventories and foreign trade reduced real GDP growth by 0.5 pp in Q3, up from a 1 pp reduction in Q2. This improvement can fully account for the 0.5 pp acceleration in Q3 real GDP growth.
The more pertinent point for the GDP outlook is that inventories lagged final sales growth by a wide margin in both of the last two quarters. Domestic businesses’ real final sales of goods and structures rose at a strong 5.6% annual rate in Q3, following a huge 11.4% leap in Q2. Yet, real non-farm inventories were only about flat in Q2 and Q3 (Chart 5).
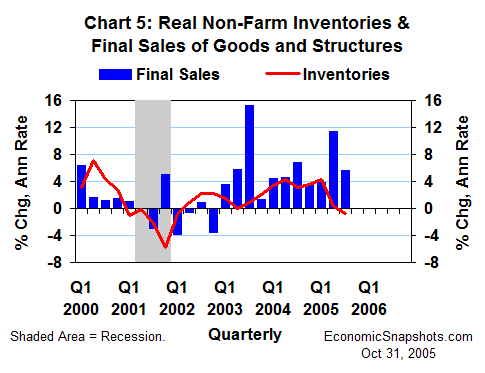
Further, the real ratio of non-farm inventories to the final sales of goods and structures fell to a new 39-year low in Q3 – an indication that inventory levels were exceptionally lean.
The resumption of more “normal” rates of inventory building (rates more in line with final sales growth) could provide an important prop for real GDP growth in Q4.
Suzanne Rizzo