| Back to Index |
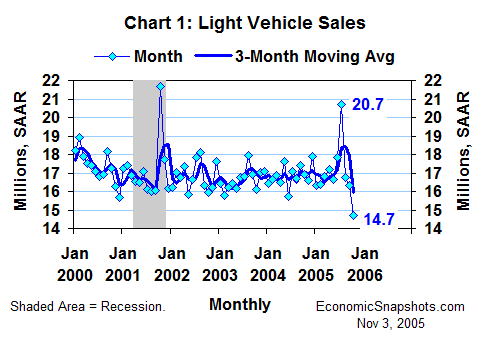
November 3, 2005 – Based on this week’s reports from the automakers, U.S. car and light truck sales plunged by 1.6M units to a 14.7M unit annual rate in October (Chart 1).

A new round of sales incentives (“employee discounts for everyone”) sent light vehicle sales soaring to 20.7M in July. These programs expired at the end of September. And, it looks like the “payback” for those extra strong July sales hit full force in October.
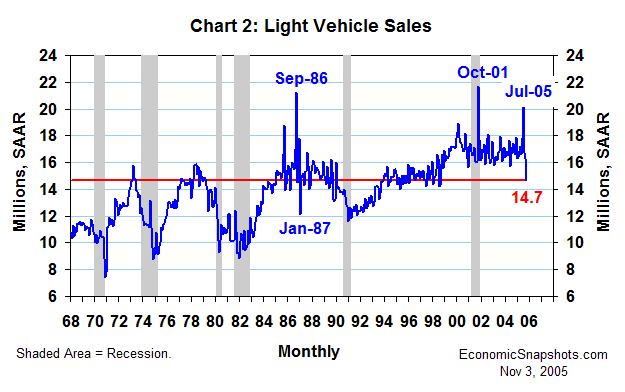
Incentives caused a similar pattern in the mid 1980’s. Light vehicle sales spiked to 21.2M in September 1986, only to fall very sharply before resuming their prior trend (Chart 2). In that episode, sales reached a low of 12.2M in January 1987.

There was no obvious “payback” after the October 2001 episode, when incentives drove light vehicle sales to 21.7M. But, that precedent doesn’t fit the current data.
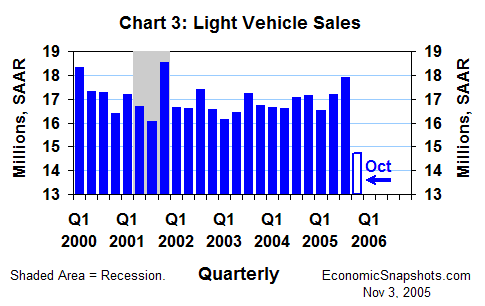
October light vehicle sales were 3.2M units below their Q3 average of 17.9M – a very weak start for Q4 (Chart 3). For Q3 as whole, light vehicle sales rose by 0.7M.

The related Q3 gains in consumers’ motor vehicle & part purchases contributed 0.9 pp to Q3 real consumption growth. (Consumption rose at a 3.9% annual rate in Q3.) This positive auto effect is well on its way to being reversed in Q4.
In addition, the sharp drop in October light vehicle sales virtually guarantees a large decline in October retail sales. To see beyond this auto-driven volatility, it will be more important than ever to focus on non-auto retail sales.
Suzanne Rizzo