| Back to Index |
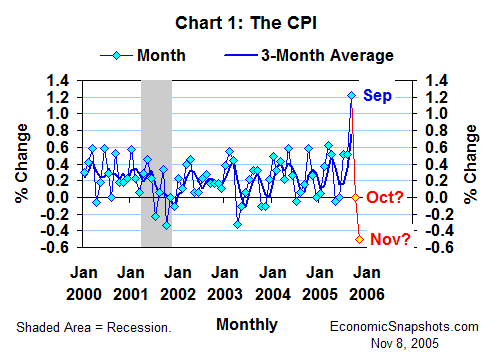
November 8, 2005 – The U.S. CPI shot up by 1.2% in September (Chart 1). The surge in September energy prices contributed about 1 percentage point (pp) of the total increase. A 17.9% leap in September gasoline prices accounted, in turn, for about 70% of the energy contribution to September CPI growth.

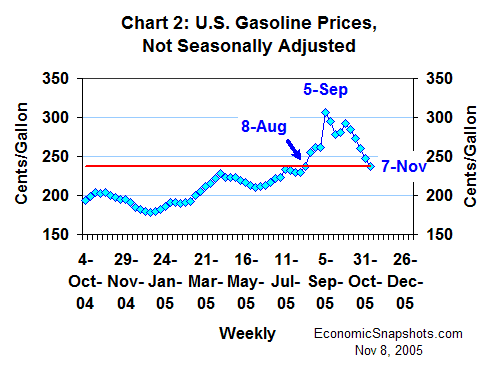
Since the end of September, however, gasoline prices have fallen for 5 straight weeks. According to the Energy Information Administration, the average U.S. retail price for regular gasoline was $2.376 on Monday, November 7 – down 10.4 cents from its level one week ago and down 69.3 cents from its September 5 peak of $3.069 (Chart 2).

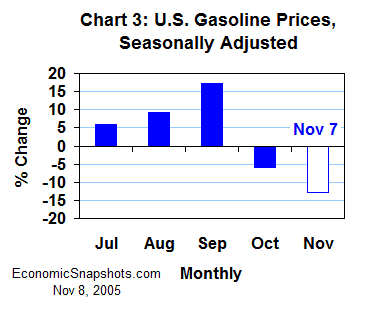
For all of October on average, these gasoline prices fell by 6.4%. This translates into a seasonally-adjusted decline of 5.9% (Chart 3).

Further, as of November 7, gasoline prices were 12.5% below their October average. If they were to simply stabilize at this level for the rest of the month, the seasonally-adjusted decline in November gasoline prices would be nearly 13%.
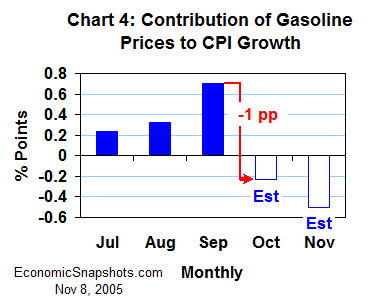
This decline in October gasoline price growth should be sufficient to slow October CPI growth by about 1 pp, compared to September’s increase (Chart 4).

The even sharper reduction currently shaping up in November gasoline prices favors even weaker CPI growth that month.
To get from here to a CPI forecast, assume some related weakening in consumer energy prices other than gasoline, and steady growth in the CPI’s non-energy components. Then, we would probably see near-zero CPI growth in October, and a November decline of about 0.5%.
Suzanne Rizzo