| Back to Index |
November 15, 2005 – The U.S. Producer Price Index for finished goods (PPI) rose by an unexpectedly strong 0.7% in October, following September’s huge 1.9% increase (Chart 1). Rising energy prices have been the key factor propelling PPI growth for the last four months. The October PPI data failed to meet general expectations for a pause in this upward energy price trend.
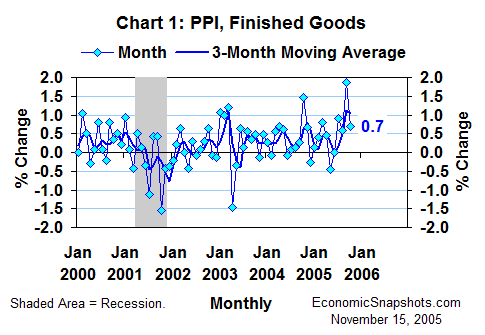
The PPI for finished energy goods rose by 4.1% in October after a 7.1% September increase. Faster October growth in prices of residential electricity, residential gas and home heating oil more than offset a 3.3% decline in gasoline prices.
These PPI results suggest some upside risk to October CPI growth (coming Wednesday). But, if the CPI were to match the PPI’s individual energy price increases exactly, the overall effect would be much smaller. This is because energy has a weight of only about 8% in the CPI compared to about 17% in the PPI. The CPI would also show less growth in total energy prices than the PPI, because gasoline prices (which fell in October) have a heavier weight in the CPI’s energy component.
Beyond energy, the closely-watched core PPI (excluding food and energy prices) fell by 0.3% in October following a 0.3% September increase (Chart 2).
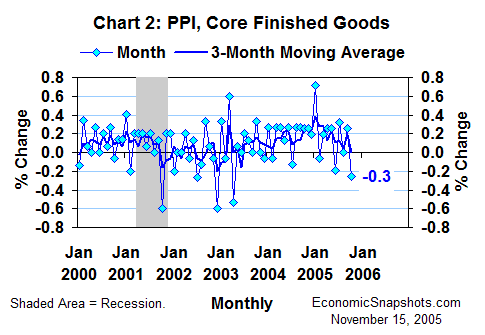
All of October’s core PPI decline can be blamed on falling car and light truck prices – a frequent source of volatility. The BLS also rotated its pricing sample to the new 2006 vehicle models in October, which complicates the interpretation of these data this month.
Excluding light vehicle prices, the core PPI rose by 0.2% in October, matching its September increase.
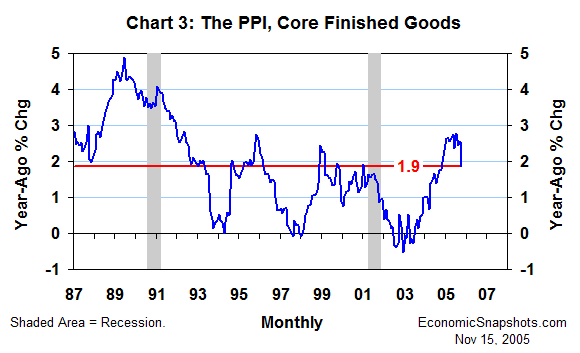
In the bigger picture, the PPI for core finished goods rose by 1.9% in the twelve months through October, slowing from a 2.6% year-ago September increase (Chart 3).
The twelve-month increase in the PPI for core crude goods slowed to a mere 1.1% in October from 6.5% the prior month.
However, the PPI for core intermediate goods rose by a hefty 4.3% in the year through October (Chart 4) – more than double the comparable increase in prices of finished goods.
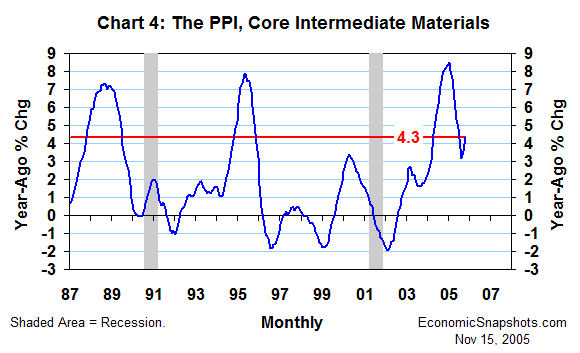
Thus, in addition to rising energy prices, these data show a continuing inflationary push from the middle of the economy’s supply chain. Firms’ lack of pricing power in consumer markets seems to be the key factor keeping these cost increases contained.
Suzanne Rizzo