| Back to Index |
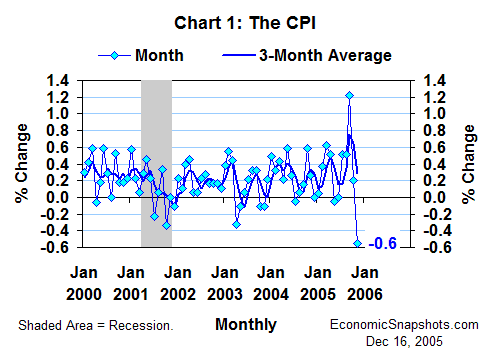
December 16, 2005 – The U.S. CPI fell by 0.6% in November, according to yesterday’s data release (Chart 1). This was the CPI’s largest monthly decline since it fell by 0.9% in July 1949.

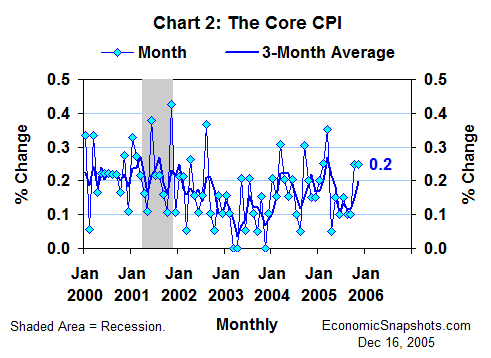
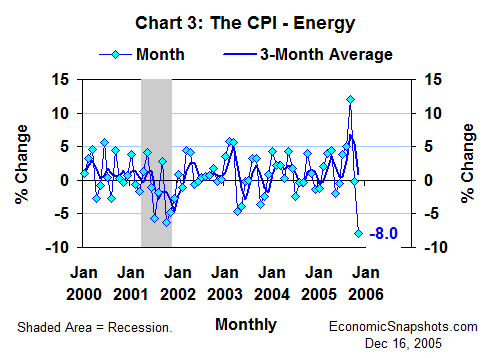
An 8% plunge in consumers’ November energy prices more than accounted for November’s total CPI decline. Consumer food prices rose by 0.3% for the third straight month in November. And, the closely-watched core CPI (excluding food and energy prices) rose by 0.2% in November, matching its October increase (Chart 2).

Soaring energy prices (Chart 3) had driven the CPI steadily higher from July through September. (Much of this recent run up in energy prices is attributable to hurricane damage suffered by the energy industry.)

November’s large energy price decline reversed some, but not all, of these prior increases. As of November, consumer energy prices were still 12% above their level in June and 21% above their level at the start of this year.
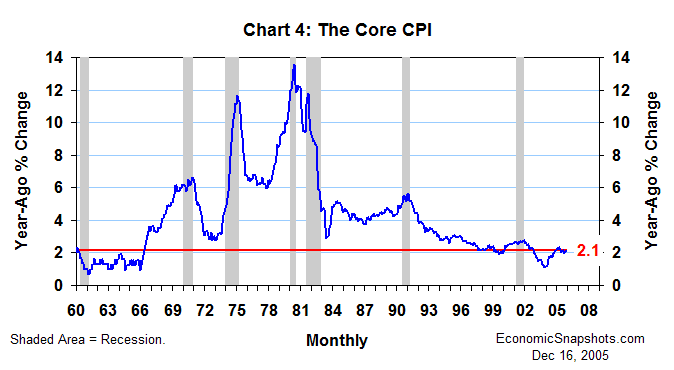
The FOMC has been worrying that, despite recent reductions, the cumulative rise in energy prices will ultimately fuel higher core inflation. However, the relatively steady trend in November CPI growth suggests that those fears had yet to be realized in November (Chart 4).

The core CPI rose by 2.1% in November, compared to the same month last year. This twelve-month trend in core CPI growth has been ranging between 2% and 2.1% for the last six months.
Suzanne Rizzo