| Back to Index |
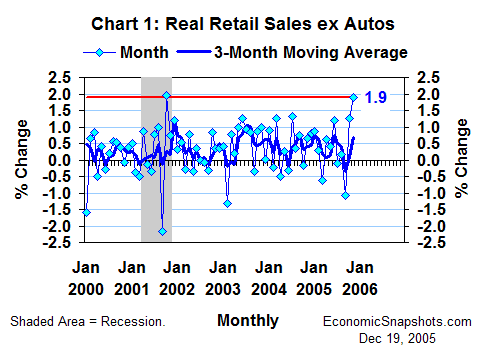
December 19, 2005 – Reflecting the downturn in energy prices, the U.S. CPI for consumer goods plunged by 2.2% in November, extending October’s 0.5% decline. With this drop in the November price level, the 0.3% decline in November non-auto retail sales translates into a stunning real gain of 1.9% – the strongest monthly increase since October 2001 (Chart 1).

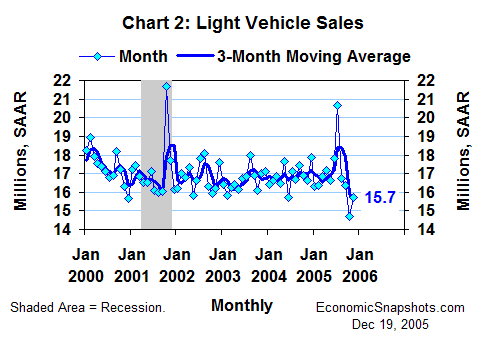
Reinforcing this extra strong real growth in sales of non-auto consumer goods, car and light truck sales rose by 6.8% to a 15.7M unit annual rate in November (Chart 2). This was the first monthly rise in light vehicle sales since their huge incentive-driven spike to 20.7M in July.

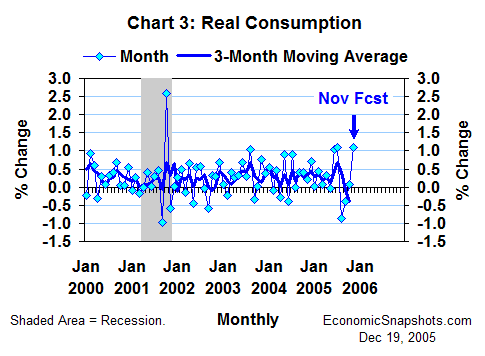
Assuming a gain of about 0.2% in consumers’ less volatile real services purchases (in line with their recent trend), these data suggest that real consumption might have shot up by 1.1% in November, after edging up by 0.1% (essentially flat) in October (Chart 3).

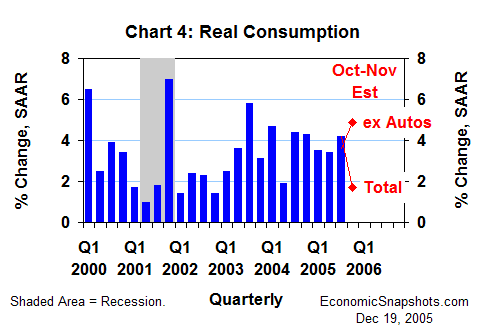
This would leave Q4 real consumption growth tracking at a 1.7% annual rate, as of the second month of the quarter. That’s not even half as much growth as Q3’s 4.2% gain (Chart 4).

To date, however, this Q4 slowing has been narrowly based in the auto sector. Excluding autos, consumption growth seems to have accelerated to about a 5% annual rate in the first two months of Q4, compared to an increase of about 3.5% for all of Q3.
Suzanne Rizzo