
| Back to Index |
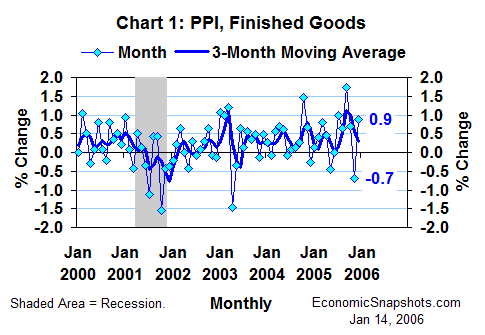
January 14, 2006 – The U.S. Producer Price Index for finished goods (the PPI) rose by a big 0.9% in December, more than reversing November’s 0.7% decline (Chart 1).
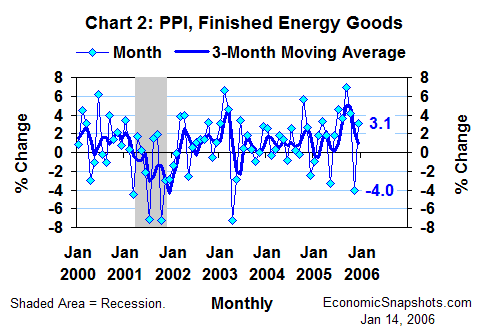
A rebound in wholesale energy prices (especially gasoline prices) accounted for all of the bounce in December PPI growth. The PPI for finished energy goods rose by 3.1% in December after a 4% November drop (Chart 2).
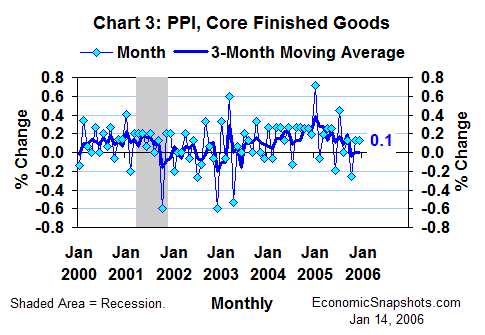
Excluding energy, the PPI rose by 0.3% in December, matching November’s increase. The closely-watched core PPI (excluding food and energy prices) rose by 0.1% in both of the last two months (Chart 3).
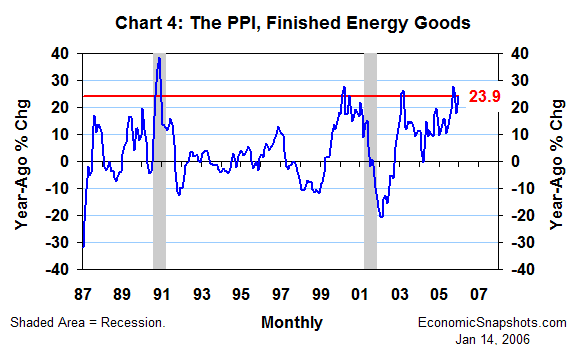
FOMC members have been worrying that the sustained high level of energy costs might eventually fuel inflationary growth in non-energy prices and wages. These data should help to keep those fears alive and well. As of December, the PPI for finished energy goods was a hefty 23.9% higher than its level in December 2004 – and only 1.1% below October’s post-hurricane peak (Chart 4).
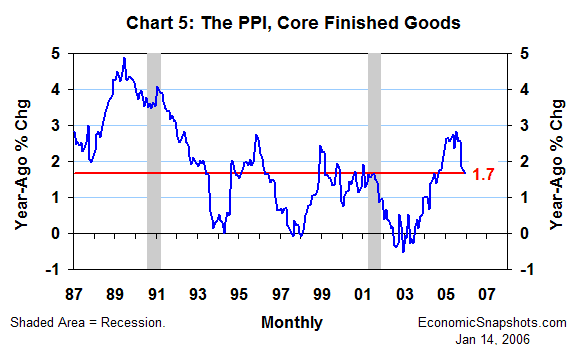
At the same time, the recent modest trend in core PPI growth reinforces the argument that the FOMC’s inflation fears aren’t coming true yet (Chart 5). The core PPI rose by just 1.7% in the twelve months through December. That’s 0.7 percentage points less growth than the comparable increase of 2.4% in December 2004.
Suzanne Rizzo