| Back to Index |
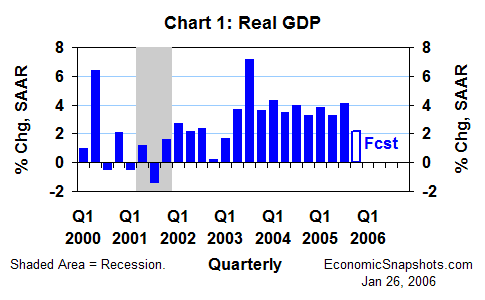
January 26, 2006 – It looks like growth in real GDP (coming Friday) slowed to a 2% to 2.5% annual rate in Q4 following a 4.1% gain in Q3 (Chart 1). Weaker Q4 consumption growth should account for virtually all of the GDP slowing. This consumer slowdown seems to be temporary – and narrowly based in the auto sector.
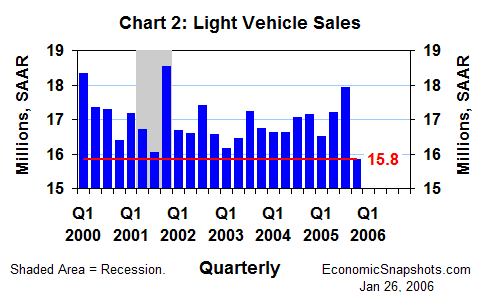
Car and light truck sales rose by a strong 1.4M units to a 17.1M unit annual rate in December, after a big 1M unit November increase. However, light vehicle sales fell from August through October, in the wake of July’s huge incentive-driven spike to 20.7M.
Reflecting this earlier (post-July) weakness, Q4 light vehicle sales plunged by 2.1M to an average 15.8M units (Chart 2). The related decline in motor vehicle & parts spending could reduce real consumption growth by about 3 percentage points in Q4.
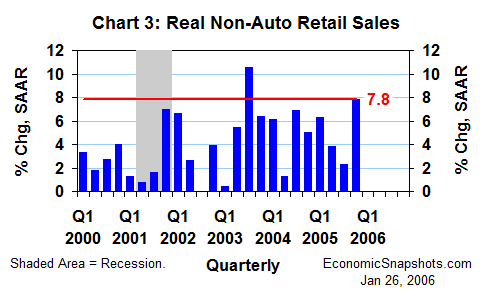
In contrast to autos, consumer demand for non-auto goods seems to have strengthened in Q4. Real non-auto retail sales rebounded to a hefty 7.8% annual rate in Q4 after slowing to 2.3% in Q3 (Chart 3).
Assuming that consumers’ real services purchases rose at a 2% to 2.5% annual rate in Q4 (in line with their October-November average), real consumption growth may have slowed to a mere 1% annual rate in Q4 after rising by 4.1% in Q3. This slowing in consumption growth would reduce Q4 real GDP growth by about 2 percentage points, compared to Q3.
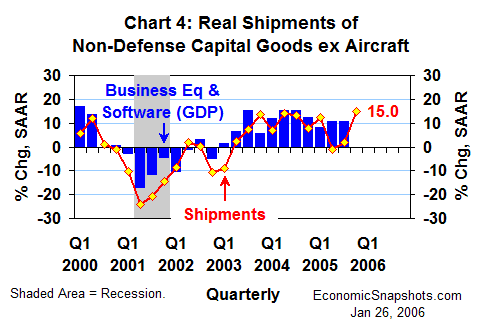
Beyond consumption, real non-defense capital good shipments excluding aircraft rose at a brisk 15% annual rate in Q4 (+1.8% in Q3, Chart 4). This suggests that Q4 growth in real business equipment & software investment may have accelerated somewhat, compared to Q3’s already-strong 10.6% increase.
However, based on two months’ data, real construction spending (residential plus non-residential) seems to have slowed a bit in Q4. Thus, the guess here is that total real fixed investment growth roughly matched Q3’s 8% gain in Q4.
Data through November also suggest a decline of about $30B in Q4 real net exports (measured in chained 2000 dollars), partially offset by firmer (less negative) real inventory growth. In Q3, the real trade deficit was roughly flat at $617.5B and real inventories fell by $13.3B.
Real government spending (always a wild card) rose at a relatively strong 2.9% annual rate in Q3. This forecast assumes a comparable Q4 increase.
Suzanne Rizzo