
| Back to Index |
February 6, 2006 – U.S. payroll employment (released Friday) rose by a solid 193K in January (Chart 1), following a revised 140K December increase (originally +108K).
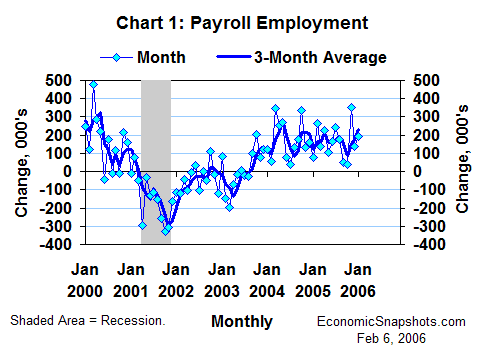
Payroll growth averaged 229K per month for the three months through January. This compares to a trend of 194K per month for the three months through August (just before Hurricane Katrina first hit these data).
The BLS warned that unusually warm January weather may have caused unusually low seasonal layoffs in the construction sector. A 46K leap in January construction jobs (+5K in December) accounted for roughly one quarter of January’s total payroll gain. To the extent that they were weather-driven, these construction jobs are liable to disappear with a return to more normal winter weather.
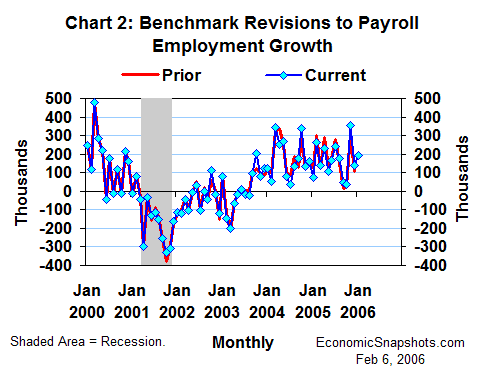
January’s payroll data include the routine annual benchmark revisions (affecting the seasonally unadjusted data back to April 2004), and updated seasonal adjustment factors (affecting the seasonally adjusted data for the last five years).
For 2005, these revisions reduced total payroll job growth by an average of 26K per month in the first half of the year, and increased it by an average of 19K per month in the second half (Chart 2). In level terms, revisions reduced December payrolls by a net 97K (-0.1%). Qualitatively, these changes were small.
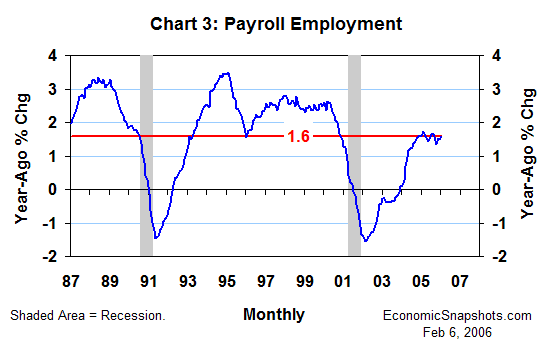
January payrolls rose by 1.6% compared to the same month last year – still a relatively poor showing in a business-cycle context (Chart 3). For the matching month of the last expansion, this increase was 2.8%.
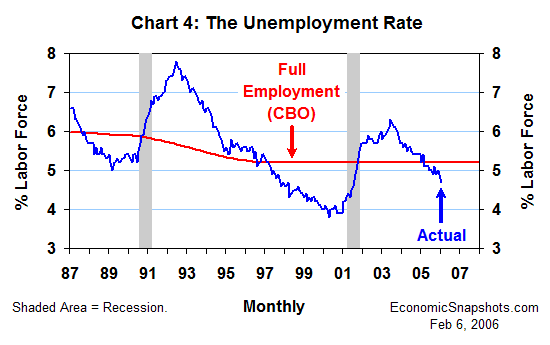
The unemployment rate fell by 0.2 percentage points to 4.7% in January – a half percentage point below the Congressional Budget Office’s estimate of its full employment level (Chart 4). In contrast to payrolls, this low and falling unemployment rate seems to suggest an overheating labor market.
However, the absence of any cyclical recovery in the labor force participation rate continues to suggest that the unemployment rate may be understating the economy’s untapped labor supply. The January labor force participation rate was unchanged at 66.0%.
Average hourly earnings rose by 3.3% in January, compared to the same month last year (Chart 5). This 12-month trend in earnings growth has risen by 0.7 percentage points since the end of Q3 last year.
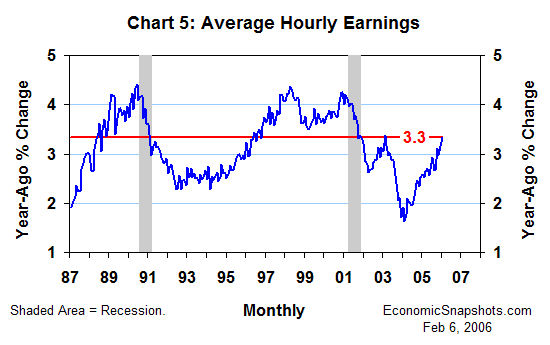
However, in the Q4 Employment Cost Index, faster earnings growth was offset by slower growth in benefit costs. Thus, recent months' extra earnings growth seems to be a compositional change in total labor costs, rather than an acceleration.
Suzanne Rizzo