| Back to Index |
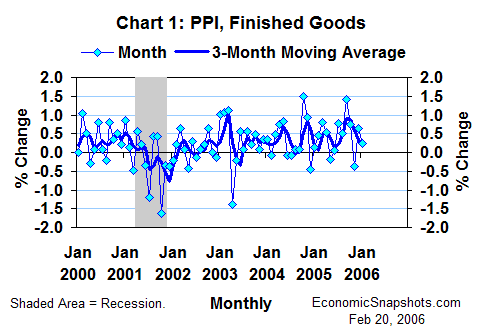
February 20, 2006 – According to Friday’s data release, the U.S. Producer Price Index for finished goods (the PPI) rose by 0.3% in January after an oversized 0.6% December increase (Chart 1). However, factoring in November’s 0.4% decline, PPI growth averaged a moderate 0.2% per month for the three months through January.

Wholesale food and energy prices both showed slower January growth. The PPI for consumer foods rose by 0.2% in January (+0.8% in December), and the PPI’s energy component was unchanged in January (+2% in December).
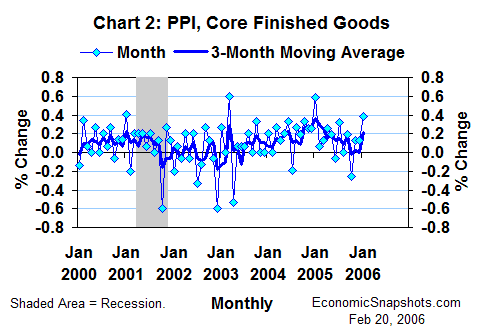
In contrast, growth in the closely-watched core PPI (excluding food and energy prices) accelerated to 0.4% in January (+0.1% in December, Chart 2). Nevertheless, factoring in the prior two months’ unusually low increases, core PPI growth also averaged a moderate 0.2% per month for the latest three months.

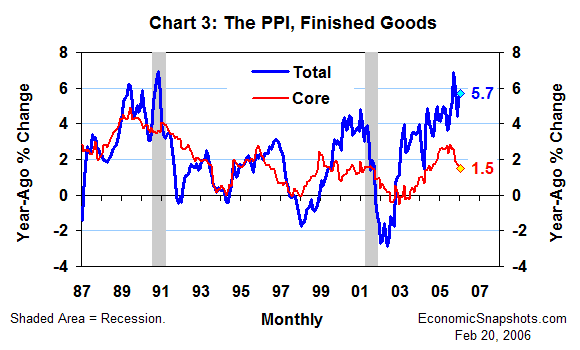
Compared to the same month last year, the PPI rose by a big 5.7% in January (Chart 3), boosted by a 25% surge in finished energy prices.

In contrast, the core PPI rose by a mere 1.5% in the year through January. Further, as of January, the twelve-month trend in core PPI growth had slowed by almost 1.5 percentage points compared to its recent peak of 2.8% in July last year.
FOMC members have been afraid that sustained high energy costs might eventually cause faster growth in non-energy prices. The PPI data suggest that those fears had yet to be realized in January.
Suzanne Rizzo