| Back to Index |
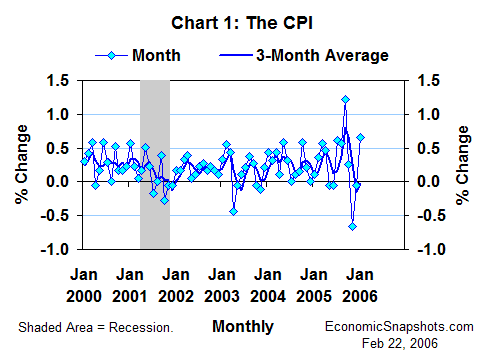
February 22, 2006 – The U.S. Consumer Price Index (CPI) rose by a big 0.7% in January after a December decline of 0.1% (Chart 1). Volatility in energy prices continued to dominate the overall pattern of CPI growth.

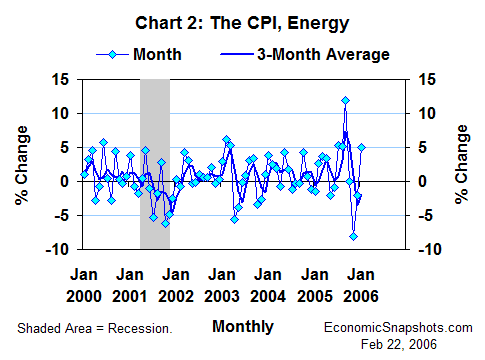
Consumer energy prices rose by 5% in January after falling by 2.1% in December (Chart 2). Within the energy price detail, residential fuel oil prices fell by 1.2% in January (-1% in December), but gasoline prices rose by 6.4% (-2.7% in December) and prices of residential natural gas & electricity rose by 4.2% (-1.6% in December).

Beyond energy, consumer food prices rose by 0.5% in January (+0.1% in December).
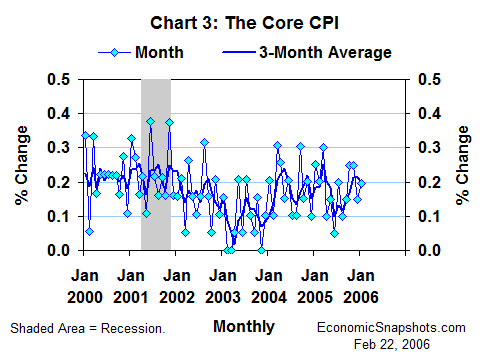
And, the core CPI (excluding food and energy prices) rose by 0.2% in January after a 0.1% December rise (Chart 3).

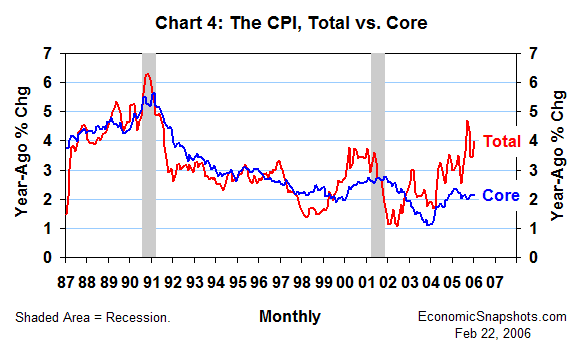
Compared to the same month last year, the CPI rose by 4% in January (Chart 4) – propelled by a 24.8% leap in consumer energy prices during this time frame.

The core CPI rose by a far more moderate 2.1% in the twelve months through January – only about half the total CPI increase. This twelve-month trend in core CPI growth has been confined to a narrow 2% to 2.2% range for the last ten months.
FOMC members are bound to find some reassurance in this steady core CPI trend. However, that won’t stop them from worrying about the future inflation risks posed by the current combination of painfully high energy costs, relatively high rates of resource utilization and the recent burst of consumer demand growth.
In particular, even after deducting the unusually large 0.9% increase in January consumer good prices (-0.3% in December), real non-auto retail sales still rose by a hefty 1.3% in January. Growth in these real non-auto sales has been averaging 1.2% per month (a 16% annual rate) for the last four months.
Suzanne Rizzo
Note: The January CPI report included revised seasonal adjustment factors and an updated CPI “market basket”. (In the latter, the prior set of 2001-02 CPI expenditure weights were replaced with data for 2003-04.) These changes affected the CPI data from January 2001 onward. Their impact on total and core CPI growth was very small.