| Back to Index |
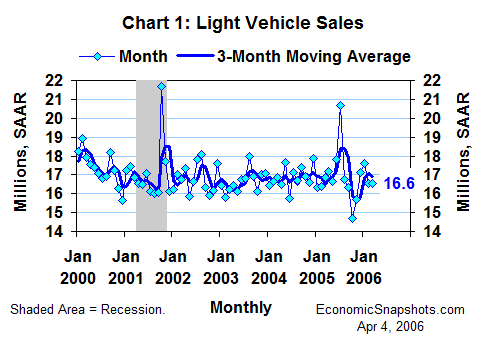
April 4, 2006 – Based on reports from the vehicle makers, U.S. car and light truck sales were about unchanged in March at about a 16.6M unit annual rate (Chart 1).

Given these flat light vehicle sales, the auto sector will probably play only a minor role in March retail sales and consumption growth.
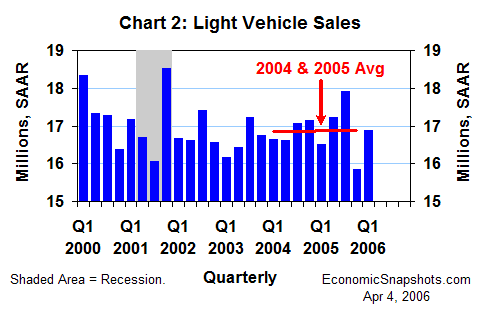
In contrast, light vehicle sales rose by a big 1M units for Q1 as a whole, reversing about half of Q4’s 2.1M unit plunge (Chart 2).

The related Q4 declines in real motor vehicle & parts spending reduced Q4 real consumption growth by a remarkable 2.7 percentage points (measured at an annual rate). The upturn in these purchases in Q1 might add about one percentage point to Q1 consumption growth.
The unusually large drop in Q4 light vehicle sales (as well as the preceding Q3 spike) can be blamed on the automakers’ erratic pricing behavior. Underlying this volatility, light vehicle sales averaged 16.9M units for all of last year, the same as in 2004 – and they seem to have continued to follow this same trend in Q1.
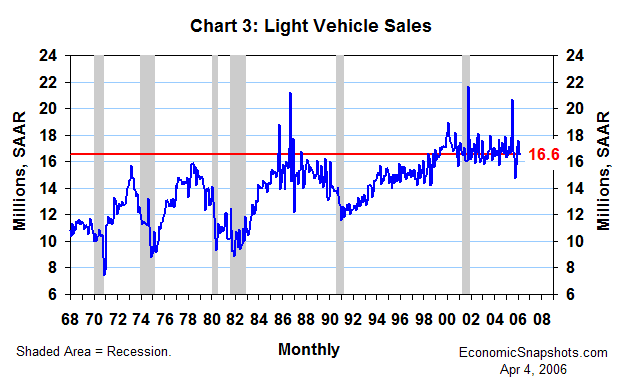
In fact, despite some substantial monthly variation (Chart 3), average annual light vehicle sales have been fluctuating in a relatively narrow 16.6M to 16.9M unit range since 2002.

Suzanne Rizzo