| Back to Index |
April 7, 2006 – U.S. payroll employment rose by a sturdy 211K in March following a revised 225K February gain (originally +243K). Revisions reduced the prior two months’ payroll growth by a total of 34K. Payroll growth averaged 197K per month for the three months through March.
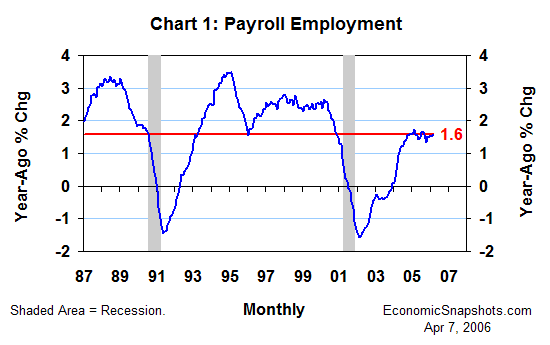
Payrolls rose by 1.6% in March, compared to the same month last year (Chart 1). That’s still a poor showing compared to the last expansion. Nevertheless, FOMC members have been worrying that recent trends in employment growth might be too strong for their goal of “sustainable” economic growth.

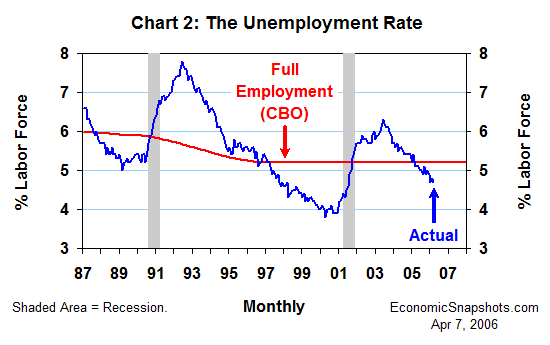
The unemployment rate edged down by 0.1 percentage point to 4.7% in March, reversing February’s increase (Chart 2). Although the unemployment rate was unchanged, on net, for the last two months, it has fallen by about a half percentage point since this time last year.

In addition, the unemployment rate has been essentially at or below the Congressional Budget Office’s estimate of its full-employment level for the last 13 months. This low/falling unemployment rate continues to suggest a relatively tight labor supply – and a relatively high risk of wage inflation.
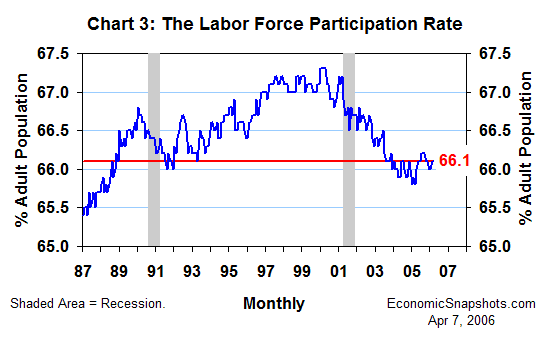
The labor force participation rate was unchanged at 66.1% in March – still relatively depressed (Chart 3). The lack of a convincing cyclical recovery in labor force participation continues to suggest that the unemployment rate might be understating the “true” size of the economy’s labor reserves.

As their January minutes hint, FOMC members seem to be divided on the issue of how low the unemployment rate can fall without sacrificing price stability. To date, their policy goal has been to try to stabilize the unemployment rate, without actively striving to push it higher.
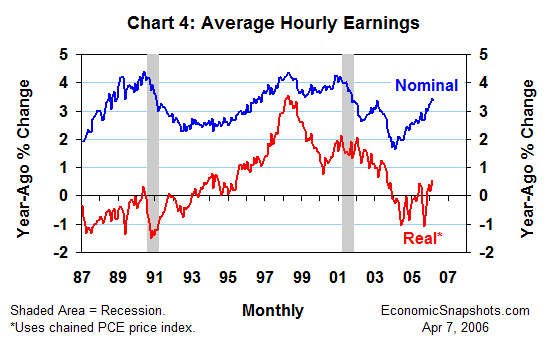
Average hourly earnings rose by 3.4% in the year through March – about even with February’s 3.5% year-ago rise and still barely keeping pace with consumer price trends (Chart 4). (Note: Real earnings are plotted only through February in Chart 4, because the March price data are not yet available.)

The restrained trend in average hourly earnings growth continues to suggest that the FOMC’s fears of inflationary overheating in the labor market aren’t being realized, yet. However, against the current backdrop of fairly strong labor demand, a relatively low unemployment rate and above-trend (“unsustainable”) real GDP growth, the FOMC will continue to worry about the unusually high inflation risk posed by the seemingly tight labor market.
Suzanne Rizzo