
| Back to Index |
April 26, 2006 – It looks like U.S. real GDP (coming Friday) might have risen by about a 4.5% annual rate in Q1 after an unusually weak 1.7% increase in Q4 (Chart 1).
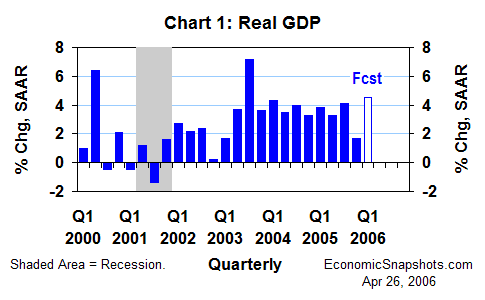
In Q1, the positive real GDP growth effects of stronger real growth in consumption, fixed investment, government purchases and net exports should be partially offset by slower real inventory growth.
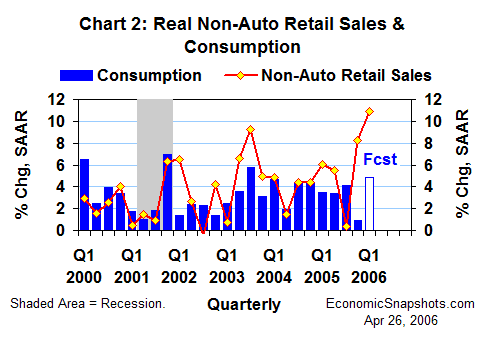
As discussed in an earlier report, real consumption seems to have risen by about a 5% annual rate in Q1 after edging up by just 0.9% in Q4. Volatility in light vehicle sales accounted for most of the weakness in Q4 consumption growth, and light vehicle sales should play a key role in the anticipated Q1 consumption rebound.
At the same time, however, the monthly data on non-auto retail sales (an indicator of consumer purchases of non-auto goods) suggest that the strength in Q1 consumption growth will extend well beyond autos. Real non-auto retail sales growth accelerated to a 10.9% annual rate in Q1, outpacing even Q4’s big 8.2% post-hurricane bounce (Chart 2).
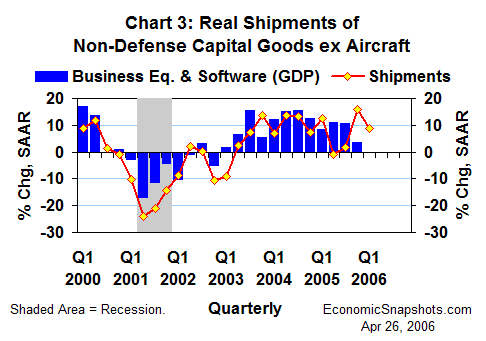
In the business sector, real shipments of non-defense capital goods excluding aircraft rose at an 8.8% annual rate in Q1 following a hefty Q4 gain of 15.7% (Chart 3). These data suggest that real business investment in equipment & software might have risen at a 5% to 10% annual rate in Q1 (+5% in Q4).
Then, with two months of data suggesting firmer real growth in total private construction spending (residential and non-residential) in Q1, total real fixed investment growth might have roughly doubled in Q1, compared to Q4’s 3.9% annual rate.
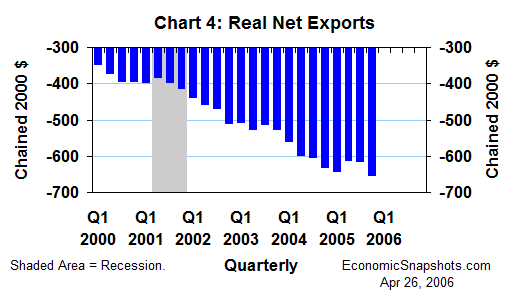
Real net exports fell by $37.7B to a deficit of $655.2B in Q4 (Chart 4), reducing Q4 real GDP growth by 1.4 percentage points. Data through February suggest that real net exports continued to fall in Q1, but by only about $10B to $15B. A less negative contribution from Q1 net exports would favor faster Q1 real GDP growth.
Real inventories rose by $37.9B in Q4 after falling by $13.3B in Q3 (Chart 5). The resulting $51.2B acceleration in Q4 inventory growth added 1.9 percentage points to Q4 real GDP growth.
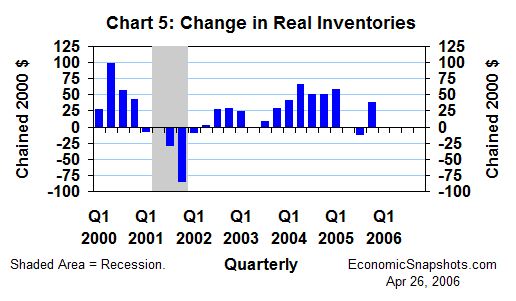
Data through February suggest that we might see only about half as much real inventory growth in Q1. Thus, inventories’ contribution to real GDP growth should fall from an unusually large positive in Q4 to a negative in Q1.
Real government spending (always a wild card) fell at a 0.8% annual rate in Q4, well below its recent trend of 1.6% per quarter for the last four-quarters. This GDP forecast assumes a rebound in Q1 government spending growth.
Suzanne Rizzo