| Back to Index |
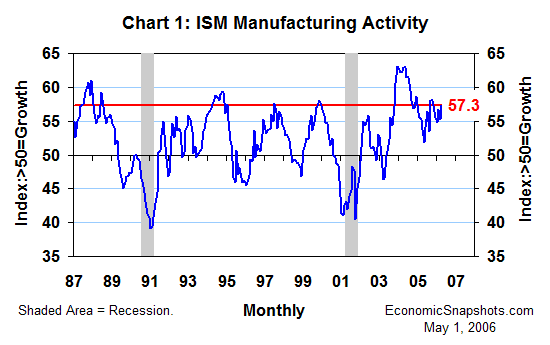
May 1, 2006 – The ISM diffusion index of U.S. manufacturing activity rose by 2.1 index points to 57.3 in April, more than reversing March’s 1.5 index point decline (Chart 1). This index has been fluctuating between 54.8 and 58.1 for the last eight months – a signal of relatively strong and relatively steady manufacturing growth.

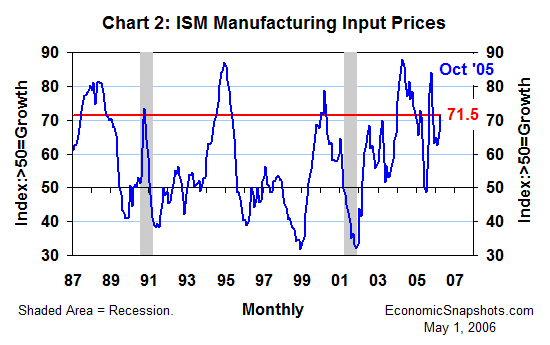
According to the ISM press release, “While many members indicate that business is good, they still have major concerns about the impact of higher prices for energy and industrial commodities.” The ISM price index rose by 5 index points to 71.5 in April – an indication of unusually rapid and accelerating growth in manufacturers’ input prices (Chart 2). This price index has risen by 9 index points in the last two months, reversing about 40% of the slowing seen since its recent peak of 84.0 in October last year.

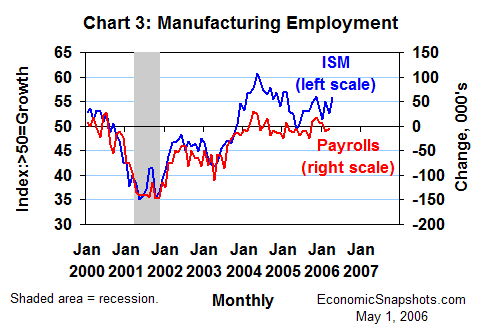
The ISM employment index rose by 3.3 index points to 55.8 in April, more than reversing March’s 2.5 index point decline (Chart 3). This sounds like a good omen for April payroll employment growth in the manufacturing sector. (The employment report is coming on Friday).

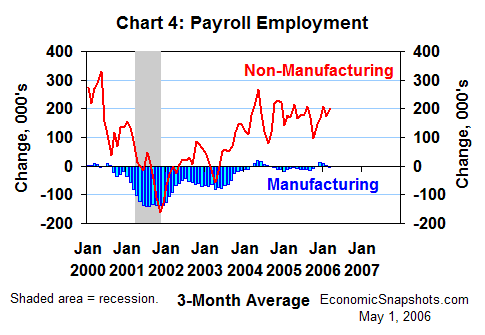
However, as far as total U.S. employment growth is concerned, non-manufacturing jobs tend to be more important (Chart 4).

Suzanne Rizzo