| Back to Index |
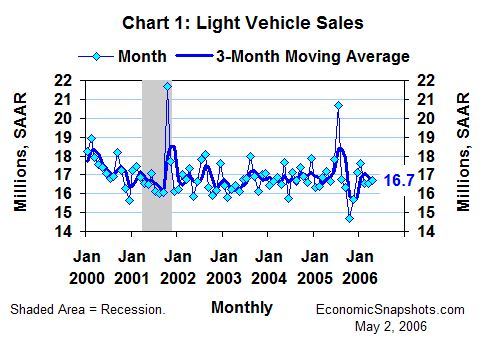
May 2, 2006 – Based on reports from the automakers, U.S. car and light truck sales edged up by about 0.2M units in April to about a 16.7M unit annual rate – approximately flat for the second straight month (Chart 1).

These data suggest that light vehicle sales (a frequent source of volatility in the consumer spending indicators) probably won’t have a major impact on April retail sales or consumption growth.
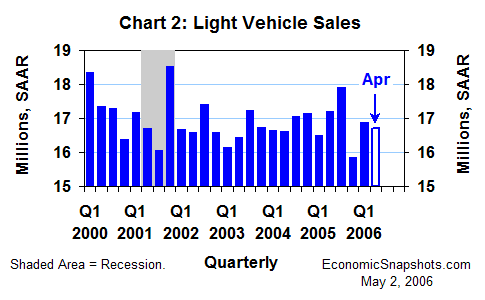
April light vehicle sales were about 0.2M below their Q1 average of 16.9M units – marking a relatively flat start for Q2 (Chart 2).

Thus, as of the first month of the quarter, light vehicle sales were also heading toward an unremarkable role in Q2 consumption growth.
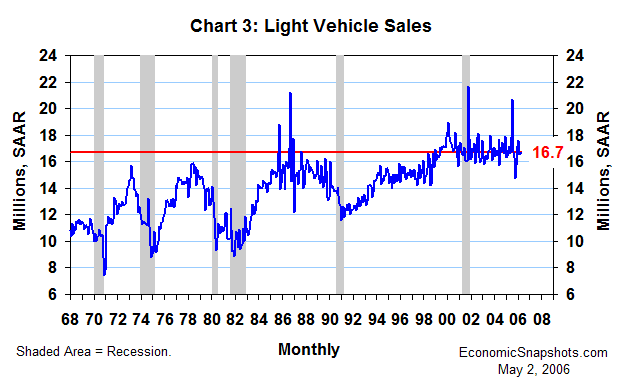
Despite some substantial monthly variations (Chart 3), the broader trend in light vehicle sales has been about flat at a historically strong level of about 16.8M units (within 0.1M units of April sales) since 2002.

Suzanne Rizzo