
| Back to Index |
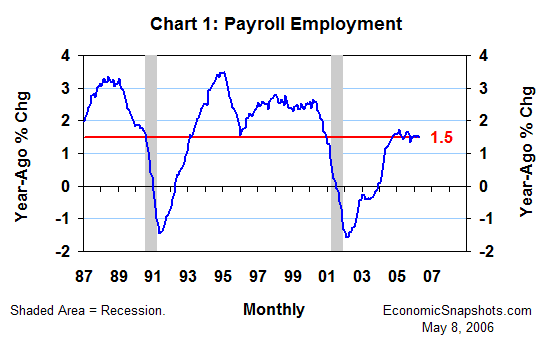
May 8, 2006 – According to Friday’s data release, U.S. payroll employment rose by 138K in April following a revised 200K March increase. Despite softer April growth, payroll employment remained on a stable trend – rising by 1.5% in April compared to the same month last year (Chart 1). This twelve-month trend in payroll growth has been running at 1.5% for the last six months.
The unemployment rate was unchanged at 4.7% in April (Chart 2). That’s a half percentage point below the Congressional Budget Office’s 5.2% estimate of its full employment level. Thus, the unemployment rate continues to suggest a relatively tight labor supply.
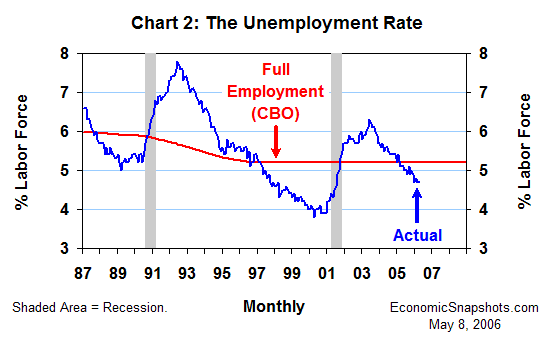
At the same time, the lack of a cyclical recovery in the labor force participation rate continues to suggest that the unemployment rate might be understating the economy’s untapped labor supply. The labor force participation rate was unchanged at 66.1% in April – and it has been ranging between 66% and 66.2% for the last 13 months. At the trough of the last recession, this rate was 66.7% – 0.6 percentage points higher than it was in April.
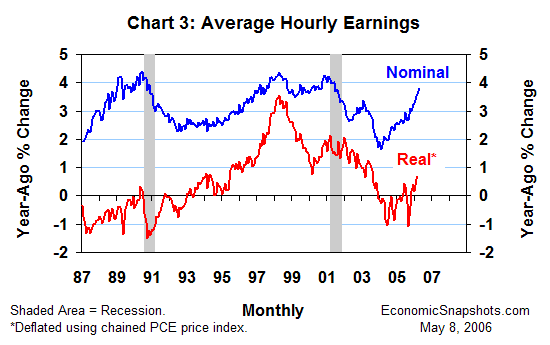
In contrast, the accelerating trend in average hourly earnings lends some support to fears of inflationary overheating in the labor market (Chart 3). Average hourly earnings rose by 3.8% in April, compared to the same month last year. In January, this 12-month increase was a half percentage point lower at 3.3%. In April last year, it was 1.1 percentage points lower at 2.7%.
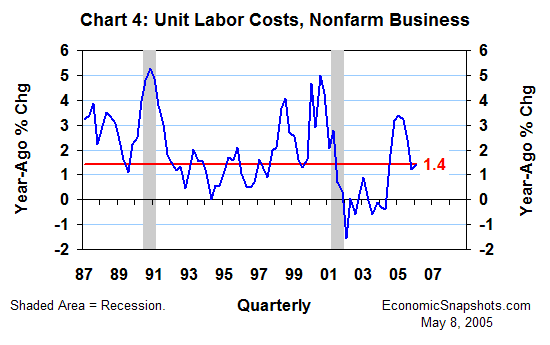
Through Q1, however, the impact of faster earnings growth on firms’ production costs was largely offset by higher productivity. Nonfarm businesses’ labor productivity (output per hour worked) rose by 2.4% in Q1, compared to the same period last year, and their unit labor costs (productivity adjusted hourly labor compensation costs) rose by a modest 1.4% – slowing from a 3.4% year-ago increase in Q1 last year (Chart 4).
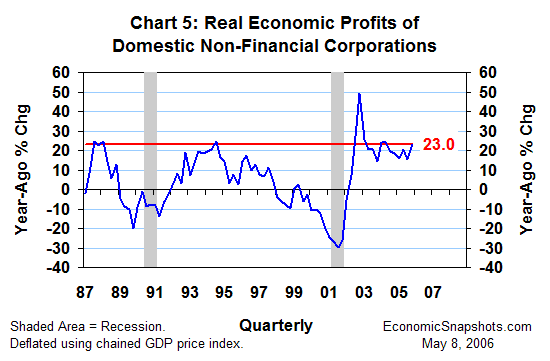
As of March, the 12-month gain in real hourly earnings remained near zero (see Chart 3). Yet, the ongoing boom in real non-financial corporate profits through Q4 suggests that U.S. firms can easily afford to pay more income to their workers without raising their prices (Chart 5).
Suzanne Rizzo