| Back to Index |
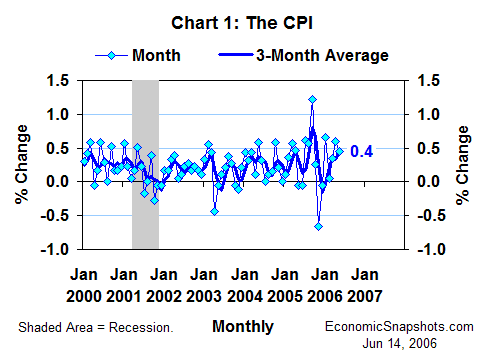
June 14, 2006 – Spurred in part by higher energy prices, the U.S. Consumer Price Index (the CPI) rose by 0.4% in May after rising by 0.6% in April (Chart 1). For the three months through May, CPI growth averaged 0.5% per month (a 5.8% annual rate).

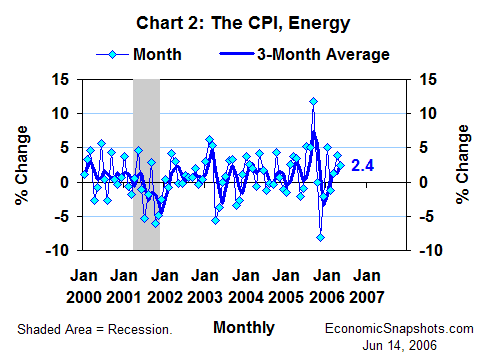
Energy prices continued to play an important role in propelling CPI growth. Consumer energy prices rose by a big 2.4% in May after an even bigger 3.9% April increase (Chart 2). For the three months through May, growth in energy prices averaged 2.5% per month (a 35% annual rate).

In contrast, consumer food prices (another notorious source of inflation volatility) were roughly flat for the latest three months. Food prices rose by 0.1% in May after being unchanged in April.
Rising energy costs, alone, don’t automatically qualify as an inflation problem, unless they begin to fuel faster growth in the prices of non-energy goods and services. Thus, the biggest news in the May CPI report was the accelerating trend in the closely-watched core CPI (excluding food and energy prices).
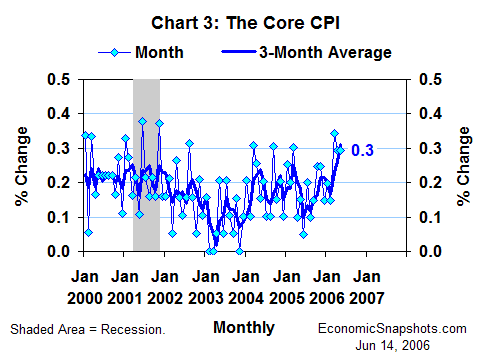
The core CPI rose by a relatively strong 0.3% in May (Chart 3). That’s not a particularly remarkable increase for any one month. The remarkable development, here, is that the core CPI has now risen by a relatively strong 0.3% for three straight months.

We haven’t seen three straight months of 0.3% core CPI growth in over a decade. Thus, what previously seemed to be a temporary deviation is now beginning to look like a sustained shift to a new, higher trend.
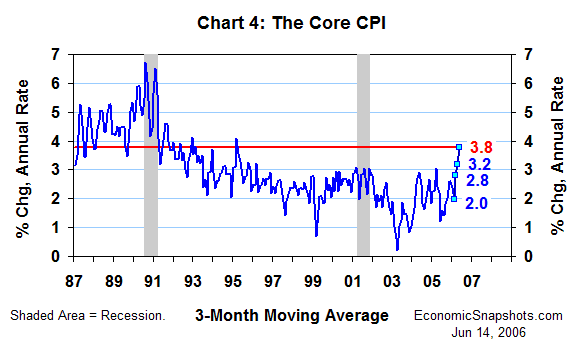
Measured at an annual rate, core CPI growth averaged 3.8% per month for the three months through May (Chart 4). That was the largest three-month increase in the core CPI since the first three months of 1995 (when core CPI growth averaged 4.1%). In April, this three-month average was 0.6 percentage points lower at 3.2%. It was 2.8% in March and, in February, it was 2%.

Referring to the April data, Fed Chairman Bernanke said earlier this month that recent monthly trends in core CPI growth had reached or exceeded the upper limits of what “many economists, including myself, would consider consistent with price stability and the promotion of maximum long-run growth.” That was fair warning that the FOMC would be very unlikely to shrug off any additional acceleration in the core CPI trend in May.
Bottom line: These data virtually seal the case for another increase in the target Fed funds rate at the next FOMC meeting on June 28-29.
Suzanne Rizzo