| Back to Index |
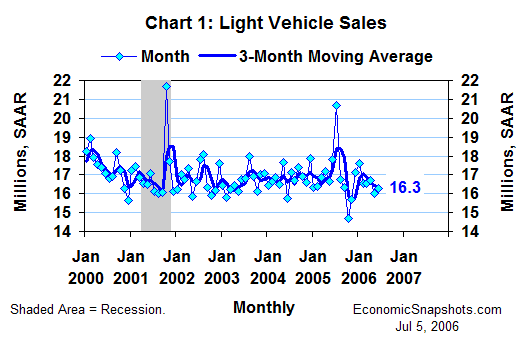
July 5, 2006 – Based on Monday’s reports from the vehicle makers, U.S. car and light truck sales were little changed in June, edging up by about 0.3M units to a 16.3M unit annual rate (Chart 1). These data suggest that the vehicle sector (a chronic source of volatility in the monthly economic indicators) will play only a minor role in June retail sales and consumption growth.

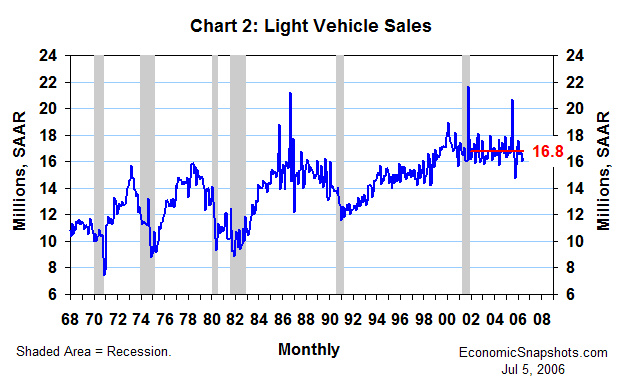
Light vehicle sales averaged 16.8M for the twelve months through June. The broader trend in these sales has been essentially flat (at an average of about 16.8M) since the end of the last recession (Chart 2).

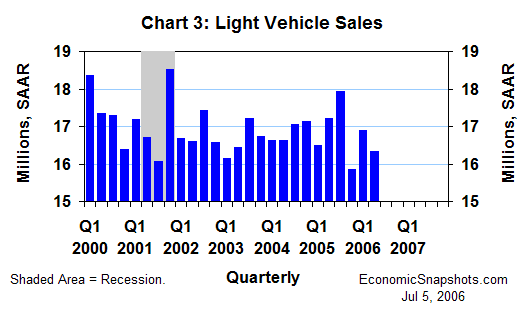
Light vehicle sales averaged a 16.3M unit annual rate in Q2 – a decline of 0.6M compared to their Q1 average (Chart 3). This is also a relatively small change, compared to recent experience. (Light vehicle sales rose by 1M in Q1 and fell by 2.1M in Q4.) Thus, the auto sector also seems set to play a relatively minor role in Q2 consumption growth.

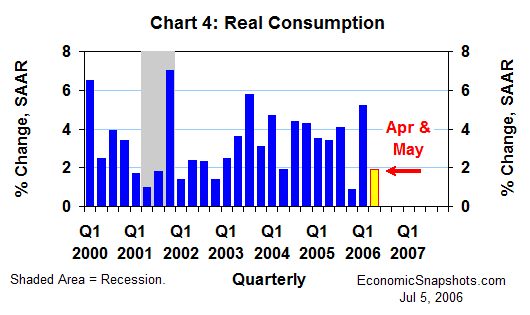
In the data released last week, real consumption growth was tracking at about a 2% annual rate for the first two months of Q2, compared to its Q1 average (Chart 4). The results for June light vehicle sales don’t change this picture. Upcoming data that might affect the Q2 consumption outlook are June non-auto retail sales and the June CPI.

Suzanne Rizzo