
| Back to Index |
July 27, 2006 – U.S. real GDP growth (coming Friday) probably slowed to about a 3.5% annual rate in Q2 after an extra-strong 5.6% Q1 gain (Chart 1).
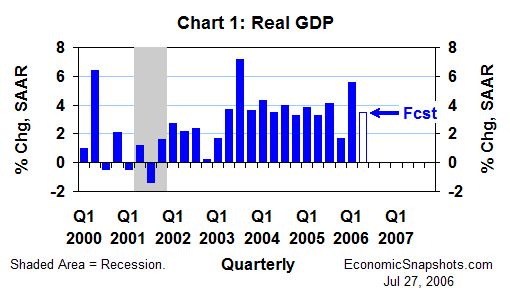
Within the Q2 GDP detail, weaker real growth in consumption and fixed investment should be partially offset by stronger real growth in inventories and net exports.
In the monthly consumption indicators, real non-auto retail sales fell at a 1.1% annual rate in Q2, after an 11.1% Q1 leap (Chart 2).
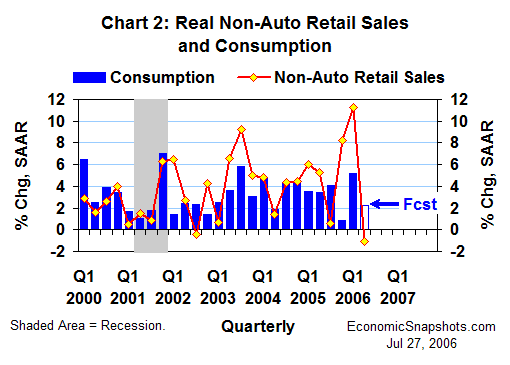
At the same time, Q2 car and light truck sales fell by 0.6M units to a 16.3M unit annual rate, reversing about half of Q1’s 1M unit increase.
Partially offsetting this falloff in Q2 demand for consumer goods, consumers’ real services purchases (about 59% of consumption) were tracking at about a 3% annual rate, as of the second month of Q2 (+1.9% for all of Q1).
Assuming steady services growth in June, real consumption growth might have slowed to about a 2.3% annual rate in Q2 after rising by 5.1% in Q1.
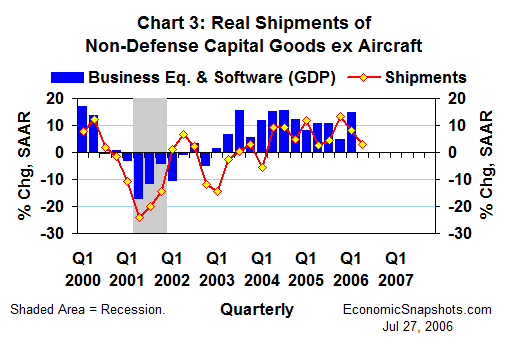
Beyond consumers, real non-defense capital good shipments excluding aircraft slowed to a 3% annual rate in Q2, compared to an 8% Q1 increase (Chart 3). This suggests that Q2 growth in real business fixed investment in equipment & software probably won’t match Q1’s 14.8% leap.
Further, based on data through May, real residential construction might have more than reversed Q1’s 3.3% annualized gain in Q2. However, the recent boom in real non-residential construction (which rose at a 12.5% annual rate in Q1) seems to have continued full force in Q2.
Putting these pieces together, total real fixed investment growth probably slowed to less than half of Q1’s strong 10.1% annual rate in Q2.
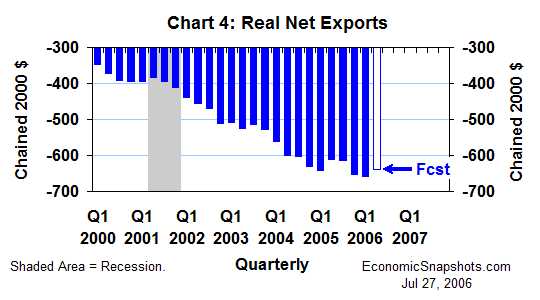
Real net exports edged down by $5.7B to $660.9B in Q1 (Chart 4), trimming 0.2 percentage points from that quarter’s real GDP growth. The monthly data through May suggest that real net exports may have risen by roughly $20B in Q2 (to a deficit of about $640B). This improvement would lift Q2 real GDP growth by about 0.7 percentage points.
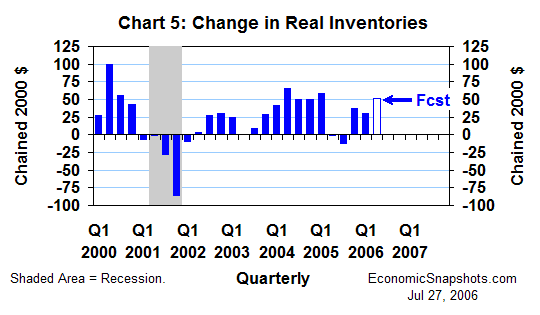
Real inventory growth fell by $8.4B in Q1 to $29.5B (Chart 5), shaving another 0.2 percentage points from Q1 real GDP growth. Based on the monthly data through May, Q2 inventory growth might have risen by about $20B (to about $50B) – enough to add another 0.7 percentage points or so to Q2 real GDP growth.
Real government spending (always a wild card) rose at an exceptionally strong 4.8% annual rate in Q1. This forecast assumes about half as much government growth in Q2.
Suzanne Rizzo