| Back to Index |
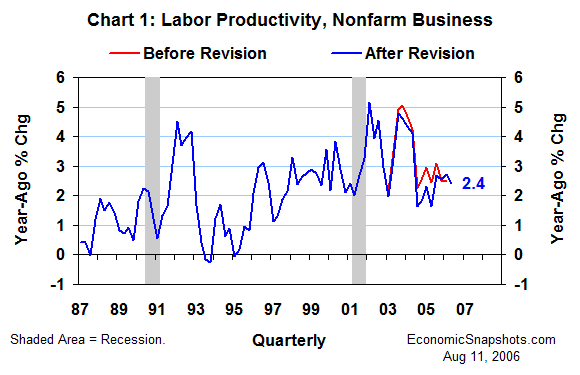
August 11, 2006 – According to data released earlier this week, U.S. nonfarm labor productivity (output per hour worked) rose by a solid 2.4% in Q2, compared to Q2 last year (Chart 1). This four-quarter productivity trend has been about 2.5% since Q3 2005.

These data incorporate the 2006 annual revisions, beginning in Q1 2003. These revisions had only a minor effect on the historical pattern of productivity growth (see Chart 1).
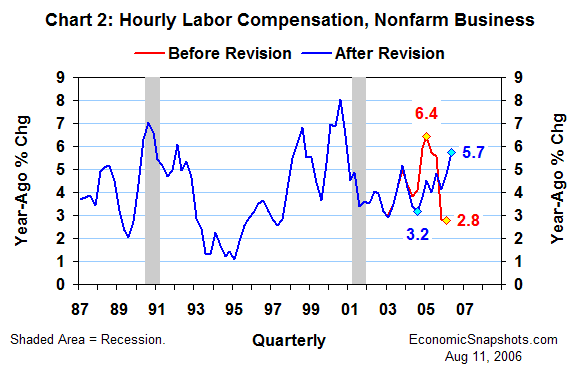
In contrast, these revisions completely reversed the recent trend in nonfarm hourly labor compensation (Chart 2).

Before revision, hourly compensation growth peaked at 6.4% in Q1 2005 (compared to the year-ago quarter). It slowed to just 2.8% in Q4 2005, and it remained at 2.8% in Q1 this year.
After revision, this four-quarter hourly compensation trend reached a low of 3.2% in Q3 2004. More recently, it gained 1.6 percentage points in the last two quarters: rising from 4.1% in Q4, to 4.8% in Q1 and to 5.7% in Q2.
Hourly compensation growth is not inflationary, if there is offsetting labor productivity growth. Unit labor costs (productivity-adjusted compensation) matter more for the inflation outlook.
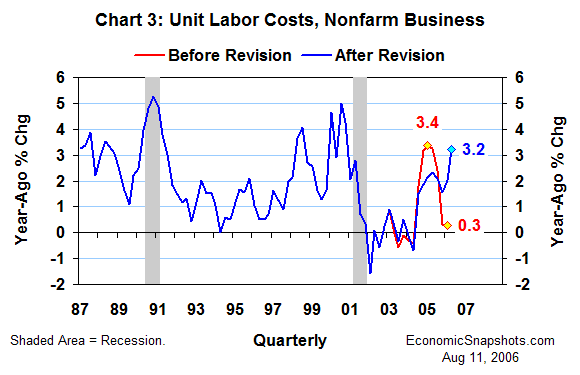
Reflecting the positive trend in labor productivity, nonfarm unit labor costs rose by 3.2% in the four quarters through Q2 (Chart 3) – 2.5 percentage points less than hourly compensation growth.

Nevertheless, the revised trend in unit labor cost growth also accelerated this year – gaining a total of 1.6 percentage points in Q1 and Q2.
In the longer-run, a 3.2% trend in unit labor costs would probably be too inflationary for the FOMC.
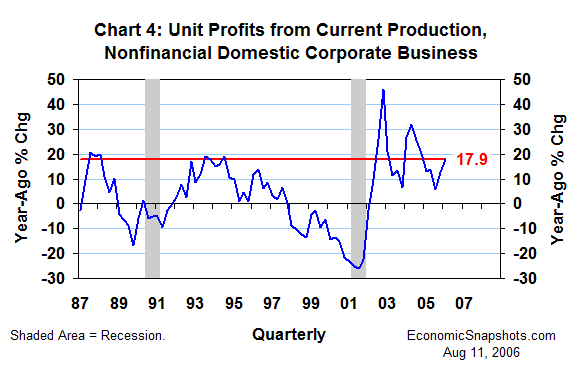
In the short-run, the four-year boom in corporate profits suggests that firms can easily afford to pay their workers more. Nonfinancial domestic corporations’ unit profits from current production rose by 17.9% in the year through Q1 (Chart 4).

Thus, Fed Chairman Bernanke indicated in his July economic testimony that faster unit labor cost growth “over the next couple of years” would not necessarily provoke tighter U.S. monetary policy – as long as these extra labor costs were met by narrowing profit margins (which are “currently relatively wide”), rather than faster price growth.
However, when Bernanke spoke, the latest data showed a miniscule 0.3% rise in unit labor costs for the year through Q1 (now revised to +2%). At this point, with unit labor costs trending in a more substantial 3% to 3.5% range, FOMC members would probably rather not see further acceleration in unit labor cost growth.
Suzanne Rizzo