| Back to Index |
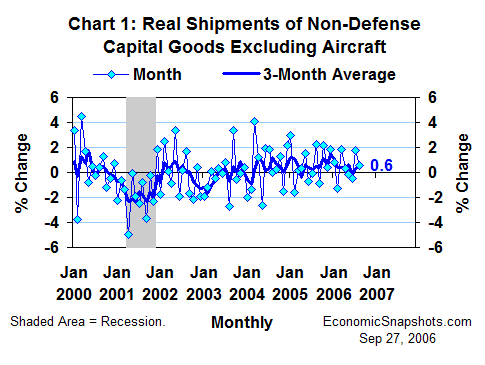
September 27, 2006 – Real U.S. shipments of non-defense capital goods excluding aircraft rose by 0.5% in August, extending July’s 1.8% gain (Chart 1).

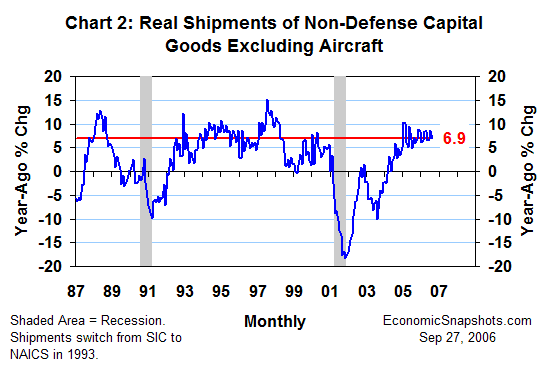
For the twelve months through August, real shipments of non-defense capital goods excluding aircraft rose by a sturdy 6.9% (Chart 2).

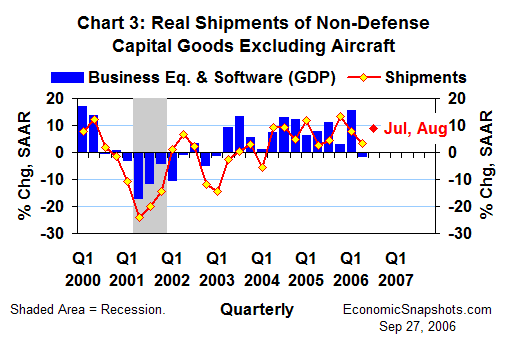
Compared to their Q2 average, real shipments of non-defense capital goods excluding aircraft rose at an 8.7% annual rate in the first two months of Q3 (Chart 3). For all of Q2, these shipments rose at a 3.2% annual rate.

According to the BEA’s preliminary GDP report, real business fixed investment in equipment & software fell at a 1.6% annual rate in Q2. As of August, these data on capital good shipments were pointing to a rebound in Q3.
Business equipment & software investment accounts for about 7.5% of U.S. GDP.
Suzanne Rizzo