| Back to Index |
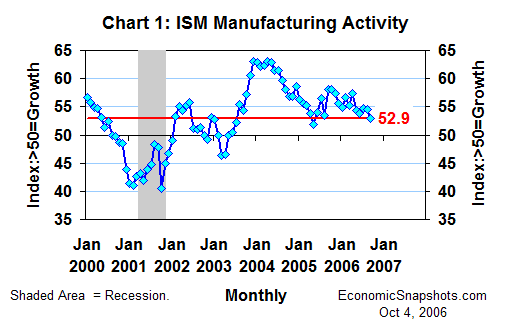
October 4, 2006 – The ISM diffusion index of U.S. manufacturing activity (released Monday) fell by 1.6 index points to 52.9 in September – a signal of tepid manufacturing growth (Chart 1).

According to the ISM press release, “It’s apparent that manufacturing is losing momentum and feeling the effects of higher interest rates and a weaker housing market.”
The ISM new order index was unchanged at 54.2 in September and the production index edged down by a half index point to 56.1. Both of these indices continued to suggest fairly robust growth through September.
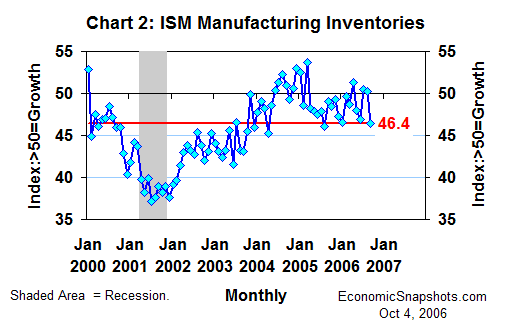
However, the ISM inventory index fell by 3.8 index points to 46.4 in September (Chart 2). Apparently, manufacturers took steps in September to eliminate the undesired inventory accumulation noted in the August ISM manufacturing survey.

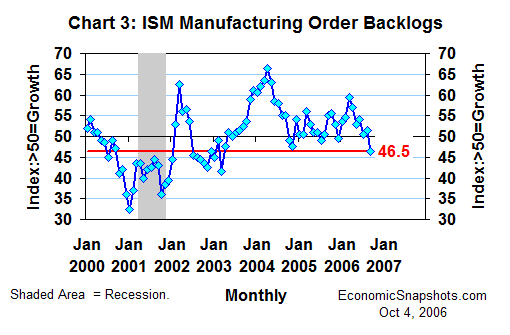
Further, although the decline in the September production index was relatively slight, the ISM order backlog index plunged by 5 index points to 46.5 in September – indicating a shift from rising to falling order backlogs (Chart 3).

September’s level was a 42-month low for the order backlog index. Fewer order backlogs mean relatively less demand for manufacturers’ future production.
The ISM input price index plunged by 12 index points to 61.0 in September – signaling slower, but still very strong, growth in manufacturers’ input costs. This index has been running at 60 or higher for fourteen straight months. Despite slowing real activity growth, manufacturers don’t seem to be getting any major relief (yet) on the input cost front.
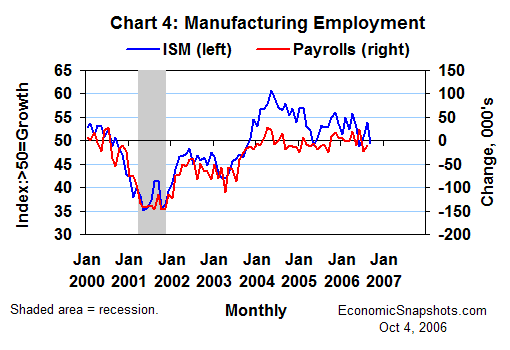
The ISM employment index fell by 4.6 index points to 49.4 in September, more than reversing August’s 3.3 index point leap (Chart 4). According to the ISM, a sustained employment index level in excess of 48.9 has been historically consistent with a positive trend in manufacturing payroll employment.

Despite its September decline, the ISM employment index stopped well short of suggesting a major manufacturing-led rout in U.S. job growth. The latter was a key feature of the U.S. economic landscape in the six months just before the start of the last recession.
Suzanne Rizzo