| Back to Index |
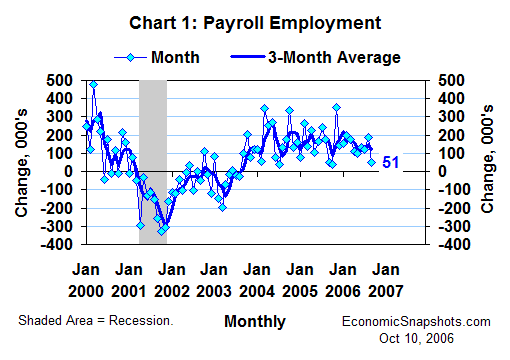
October 10, 2006 – According to data released on Friday, U.S. payroll employment rose by a mere 51K in September (Chart 1). That’s essentially no growth at all. At the same time, however, a large upward revision raised August job growth by 60K to 188K.

Thus, despite September’s slowing, the underlying trend in payroll jobs still looks about the same. Payroll growth averaged a relatively modest 120K per month in August and September, about matching the 118K average monthly payroll gain for the six months through September.
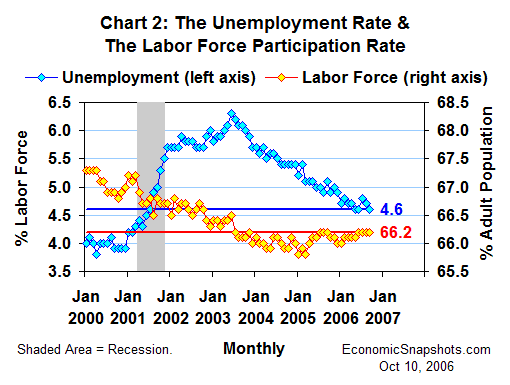
The unemployment rate was also essentially unchanged in September, edging down by 0.1 percentage point to 4.6% (Chart 2). The September labor force participation rate was steady at 66.2%.

As of September, the unemployment rate was 0.4 percentage points below the Congressional Budget Office’s 5% estimate of its full-employment level – still indicating a relatively tight labor market.
However, the stubborn absence of any cyclical recovery in labor force participation since the end of the last recession continues to suggest that the measured unemployment rate might be currently understating the “true” size of the economy’s labor reserves.
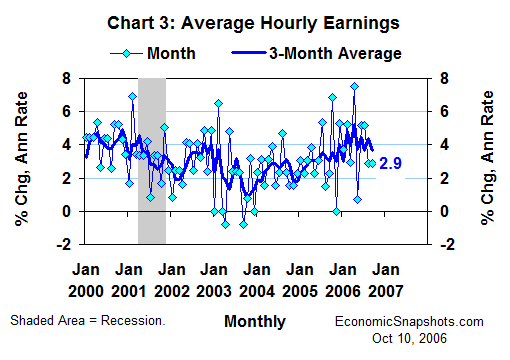
Average hourly earnings rose by 0.2% in September (a 2.9% annual rate), matching their August increase (Chart 3). Average hourly earnings growth has been trending at a 4% annual rate since the start of this year.

Through August, however, all of these nominal earnings gains were being eaten up by inflation. The consumer price index rose at a 4.6% average annual rate from January through August, and the chained price index for personal consumption expenditures rose by 3.7%.
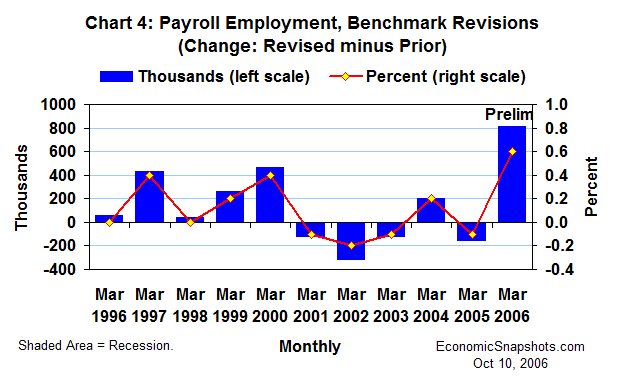
According to a preliminary estimate by the BLS, the regular annual benchmark revisions (coming in February 2007) will raise the March 2006 level of payroll employment by an unusually large 0.6% (810K, Chart 4). Within the last decade, the average benchmark revision has been plus or minus 0.2% (218K).

A 0.2% increase in the level of March payroll employment would raise the average monthly payroll gain for the twelve months through March by 68K to 237K. At this point, however, those historical gains have already been upstaged by the more sluggish trend in payroll growth that has emerged in the data since March.
Suzanne Rizzo