
| Back to Index |
October 23, 2006 – In the data released last week, the U.S. Consumer Price Index (CPI) fell by 0.5% in September after rising by 0.2% in August (Chart 1).
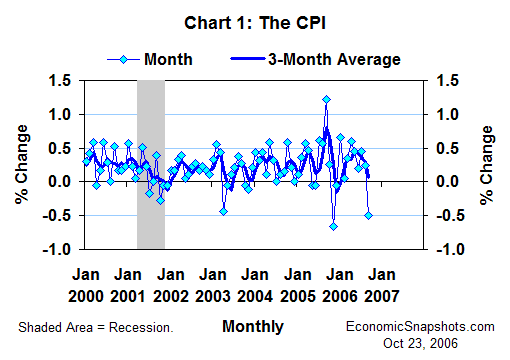
A 7.2% plunge in consumer energy prices more than accounted for September’s overall CPI decline. Excluding energy, the CPI rose by 0.2% in September, for the third straight month.
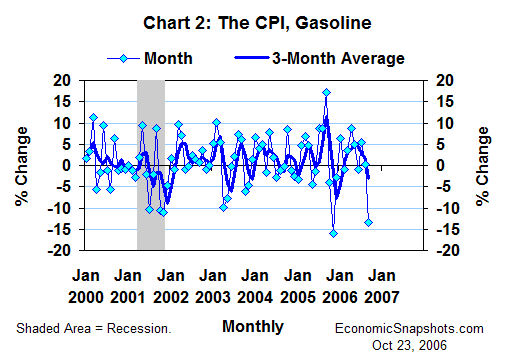
The decline in September energy prices was driven, in turn, by a 13.5% plunge in September gasoline prices (+0.2% in August, Chart 2). In contrast to gasoline, household fuel and utility prices rose by 0.7% in September (+0.3% in August).
In the weekly data from the Energy Information Administration, retail gasoline prices have continued to trend lower, averaging 11.3% below their September level in the first half of October (Chart 3). Altogether, these September-October declines have been just big enough to reverse the surge in consumer gasoline prices that occurred earlier this year.
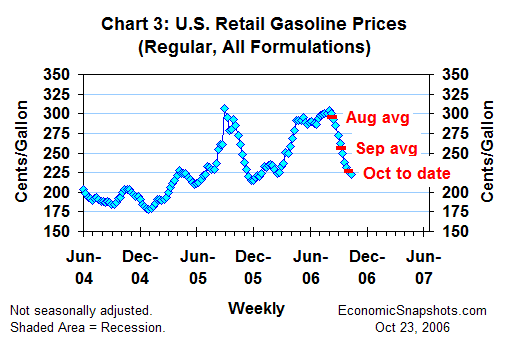
If gasoline prices were to match this partial October average for the month as a whole, we would probably see a seasonally adjusted decline of about 10.5% in the CPI for gasoline in October. That would be enough to trim about a half percentage point from October CPI growth. Thus, all else the same, the decline evident to date in October gasoline prices would be consistent with an October CPI decline of about 0.3%.
As indicated in the minutes of their September policy meeting, FOMC members have been hoping that the recent reductions in energy prices will last long enough to help “damp” the unacceptably high rate of core consumer price growth (excluding food and energy prices).
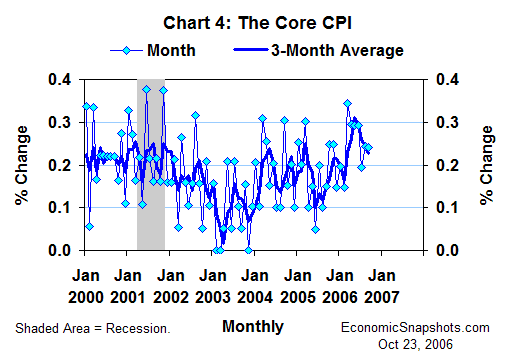
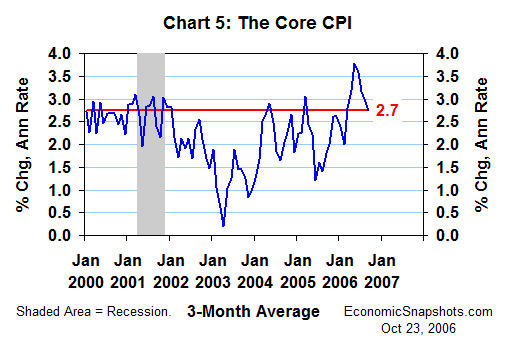
The core CPI rose by 0.2% for the third straight month in September (Chart 4), with growth averaging a 2.7% annual rate for the last three months (Chart 5). That’s an improvement compared to the 3.8% average annual rate of core CPI growth reached in the three months through May, but still high enough to bother the FOMC.
Suzanne Rizzo