| Back to Index |
October 30, 2006 – According to Friday’s data release, U.S. real GDP rose at a meager 1.6% annual rate in Q3 after a modest 2.6% gain in Q2 (Chart 1).[1]
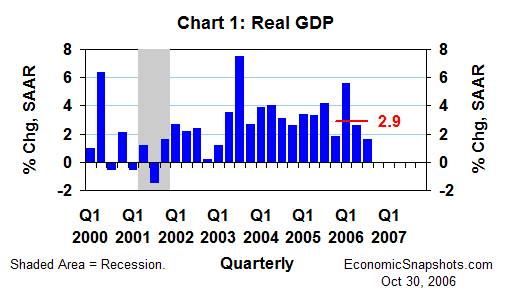
For the four quarters through Q3, real GDP growth averaged a 2.9% annual rate – slightly less than the Congressional Budget Office’s estimates of its maximum “sustainable” (or “potential”) rate of growth.[2]
Among the major GDP components (consumption, fixed investment, inventory investment, government spending and net exports), net exports and inventory investment together accounted for 1.5 percentage points (pp) of the total 1 pp slowing in Q3 real GDP growth (Chart 2).
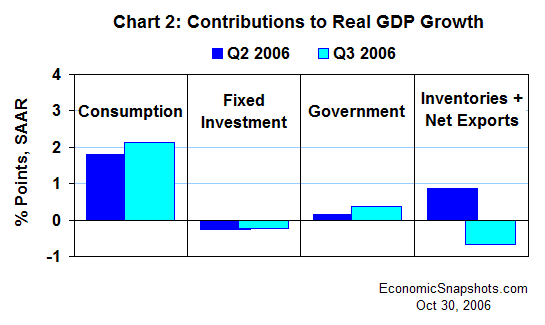
Real net exports fell by $15.7B chained 2000 dollars in Q3 (to a deficit of $639.9B), more than reversing Q2’s $12.4B increase. Compared to Q2, net exports’ contribution to real GDP growth fell by 1 pp to −0.6 pp in Q3.
Real inventory investment fell by $3B in Q3 to (+$50.7B) after rising by $12.5B in Q2. Inventories’ contribution to real GDP growth fell by 0.5 pp to −0.1 pp in Q3.
Partially offsetting these negative GDP growth effects, real consumption growth accelerated to a 3.1% annual rate in Q3 (+2.6% in Q2). Thus, consumption’s contribution to real GDP growth rose by 0.3 pp to 2.1 pp in Q3.
The Q3 improvement in consumption growth was largely concentrated in the auto sector (a notorious source of consumption volatility). However, September’s surge in sales of non-auto consumer goods may have set the stage for a more broadly-based improvement in Q4 consumption growth.
Real government spending growth firmed to a 2% annual rate in Q3 (+0.8% in Q2), raising government’s contribution to real GDP growth by 0.2 pp to 0.4 pp in Q3.
Real fixed investment (businesses’ equipment & software purchases plus residential and non-residential construction) fell at a 1.4% annual rate in Q3, about matching Q2’s 1.6% decline. Fixed investment’s contribution to real GDP growth was also about unchanged in Q3 at −0.2 pp.
In the investment data detail, a deepening rate of decline in residential construction in Q3 was more than offset by a revival in businesses’ equipment & software demand.
Real domestic final sales (consumption plus total fixed investment plus government spending) rose at a weak 2.2% annual rate in Q3, but that was stronger than Q2’s paltry 1.6% increase (Chart 3).
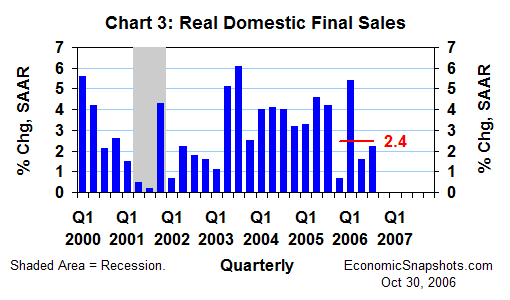
Growth in these sales averaged an unimpressive 2.4% annual rate for the four quarters through Q3.
Bottom line: a second straight quarter of lukewarm economic growth in Q3.
Suzanne Rizzo