| Back to Index |
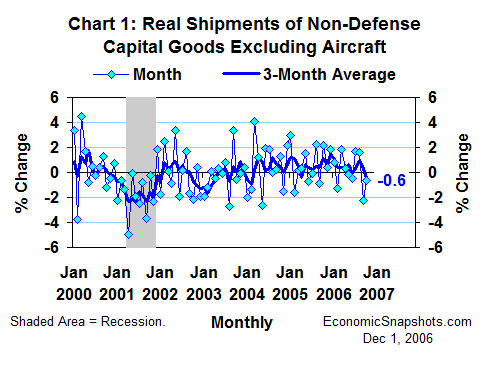
December 1, 2006 – In the data released this week, U.S. real non-defense capital good shipments excluding aircraft fell by 0.6% in October, extending September’s 2.2% decline (Chart 1).

For the three months through October, these real capital good shipments fell by an average of 0.4% per month.
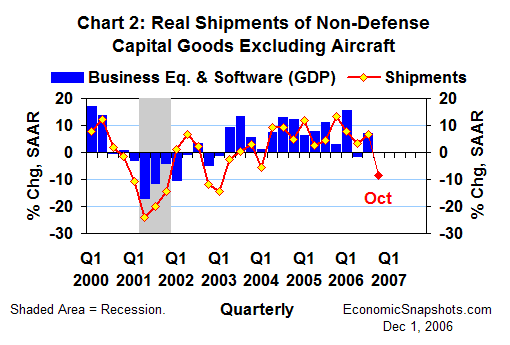
Compared to their average level in Q3, real non-defense capital good shipments excluding aircraft are now falling at an 8.4% annual rate for Q4 to date (as of the quarter’s first month, Chart 2). For all of Q3, these shipments rose at a 6.6% annual rate.

Thus, these data suggest a weak start for real business fixed investment in equipment and software in Q4. In Q3, businesses’ real equipment & software investment rose at a 7.2% annual rate.
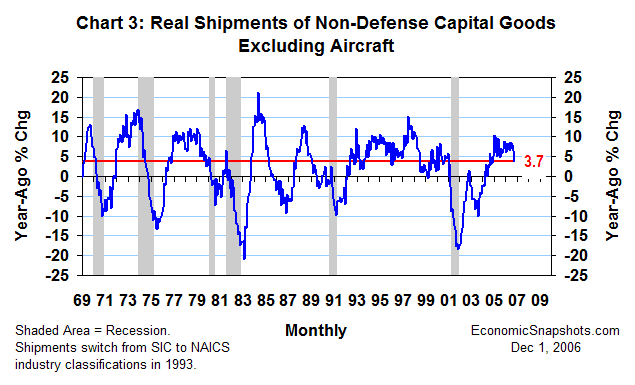
Real non-defense capital good shipments excluding aircraft rose by 3.7% in October, compared to the same month last year (Chart 3). Although it is still positive, this twelve-month trend reached a peak of 8.7% in July, and it has eroded rapidly since then.

The abrupt nature of this slowing is a disturbing development, as far as the economy’s general health is concerned. However, the continuing strong trend in corporate profits through Q3 should help to limit the downside in business equipment demand.
Suzanne Rizzo