
| Back to Index |
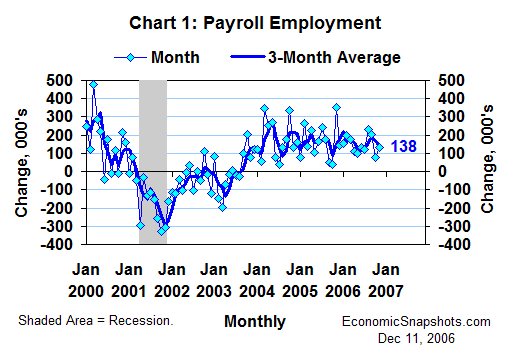
December 11, 2006 – U.S. payroll employment (released Friday) rose by 132K in November after a revised October increase of 79K (Chart 1).[1] Revisions added a net 42K to the prior two months’ payroll gains.
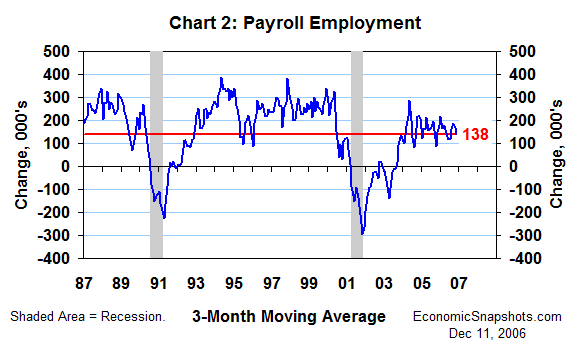
Payroll growth averaged a modest 138K per month for the three months through November (Chart 2). That’s not a particularly impressive trend, but it is more job growth than we saw just before either of the last two recessions. In March 2001 (the month just before the start of the last recession) this three-month average payroll gain was a mere 7K.
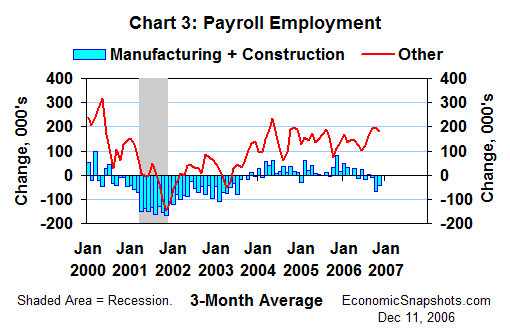
Within the data detail, manufacturing payrolls fell by an average of 23K per month for the three months through November, and construction payrolls fell by an average of 18K per month for these same three months. However, the rest of the economy has continued to generate new jobs, with payroll gains averaging 179K per month for the three months through November (Chart 3).
The unemployment rate was essentially unchanged in November, edging up by 0.1 percentage points to 4.5% (Chart 4). At 0.5 percentage points below the Congressional Budget Office’s 5% estimate of its “full employment” level, the unemployment rate continues to suggest a relatively “tight” labor market.
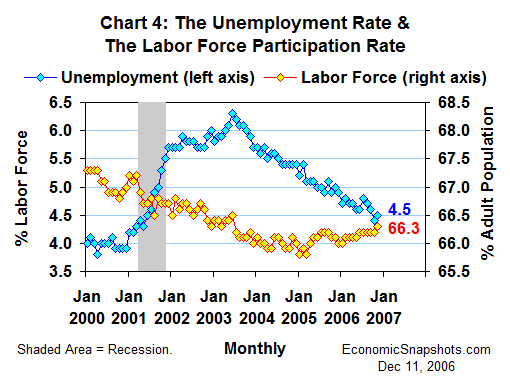
At the same time, the November labor force participation rate edged up by 0.1 percentage points to 66.3%. Although this one didn’t qualify, a substantial increase in labor force participation would help to diffuse any inflationary pressures in the labor market.
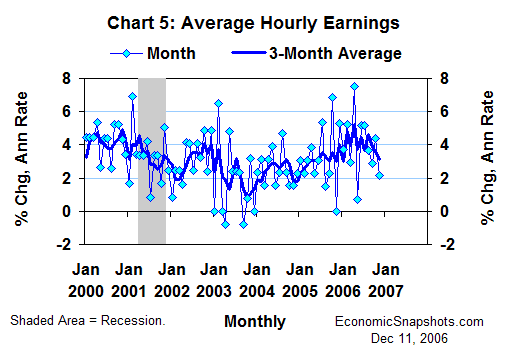
Average hourly earnings growth slowed to a 2.1% annual rate in November, after a 4.4% October increase (Chart 5). For the three months through October, these earnings rose at a 3.1% average annual rate. That’s slower than the 4.6% average increase seen for the prior three months (through August), but the twelve-month earnings trend held steady at 4%.
Bottom line: The labor market continued to look reasonably healthy in November, but not healthy enough to pose any new inflation threats to the inflation-wary FOMC. Thus, these data reinforce the case for no change in U.S. monetary policy.
Suzanne Rizzo