
| Back to Index |
December 18, 2006 – According to data released on Friday, the U.S. consumer price index (CPI) was unchanged in November, reflecting broadly based price restraint (Chart 1). The CPI fell by 0.5% in each of the prior two months, depressed by plummeting energy prices.
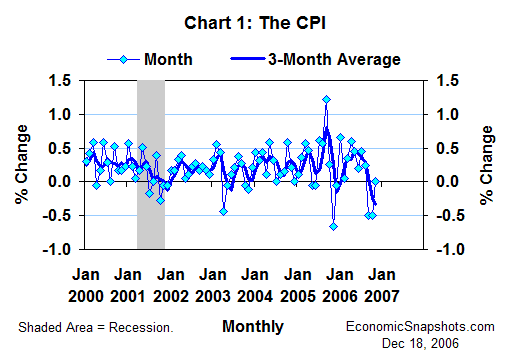
Consumer energy prices flattened out in November, edging down by 0.2% after declines averaging 7.1% per month in September and October.
Changes in gasoline prices have been dominating the overall pattern of energy price growth. Consumer gasoline prices fell by 1.6% in November, after double-digit declines in both of the prior two months (Chart 2).
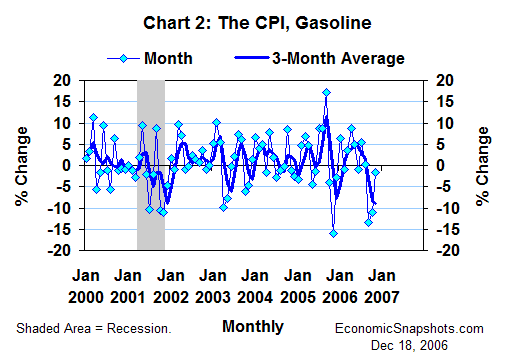
Developments in the weekly energy price data suggest that we may see higher growth in both gasoline prices and the total CPI this month. In early December, retail gasoline prices were running about 3% above their average November level. A similar increase for the month as a whole would be consistent with seasonally-adjusted growth of 6.5% to 7% in the December CPI for gasoline. That would add about 0.3 percentage points to December CPI growth.
Consumer food prices fell by 0.1% in November, reversing part of October’s 0.3% increase.
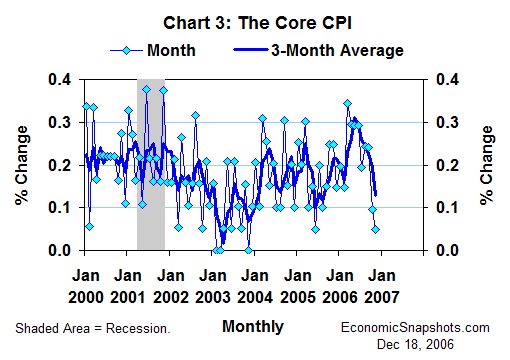
The closely-watched core CPI (excluding food and energy prices) was unchanged in November, compared to an October increase of 0.1% (Chart 3).
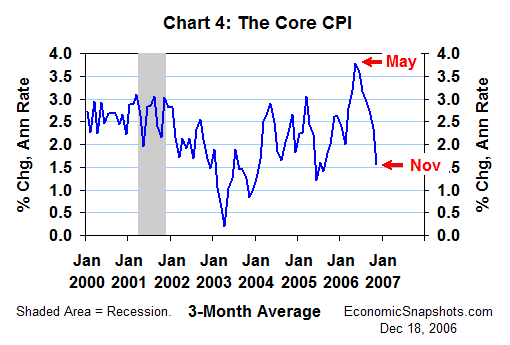
For the three months through November, the core CPI rose at a modest 1.6% average annual rate (Chart 4). As of November, this three-month trend had slowed by 2.2 percentage points compared to its recent peak of 3.8% for the three months through May.
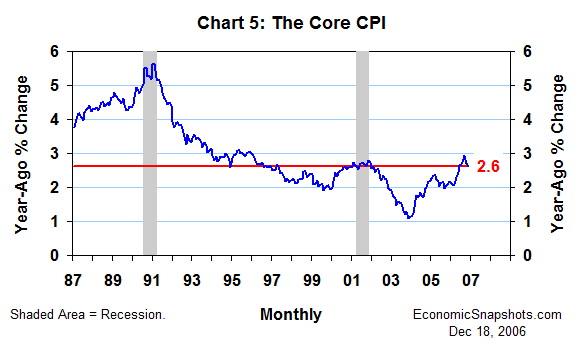
The broader twelve-month trend in core CPI growth has also shown some signs of slowing, although it probably still looks too strong to the inflation-wary FOMC (Chart 5). The core CPI rose by 2.6% in November, compared to the same month last year. That’s 0.3 percentage points less core CPI growth than September’s 2.9% peak.
Suzanne Rizzo