| Back to Index |
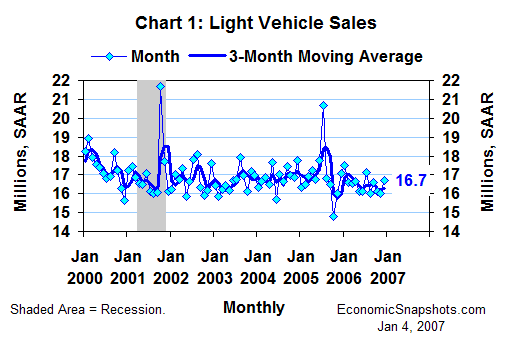
January 4, 2007 – Based on this week’s reports from the vehicle makers, U.S. car and light truck sales rose by about 0.7M units in December to an estimated 16.7M unit seasonally adjusted annual rate (Chart 1).

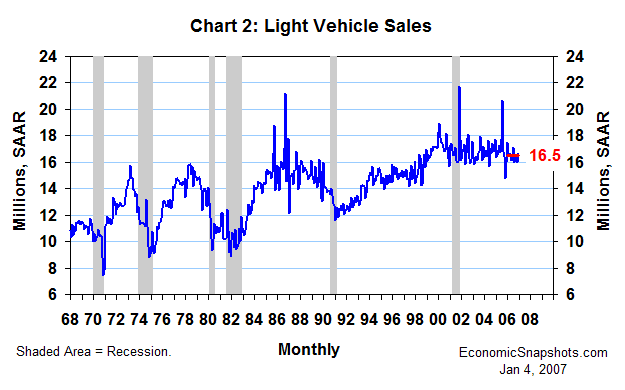
For 2006 as a whole, light vehicle sales averaged about 16.5M units. That’s 0.4M units less than 2005, but still a healthy level by broad historical standards (Chart 2).

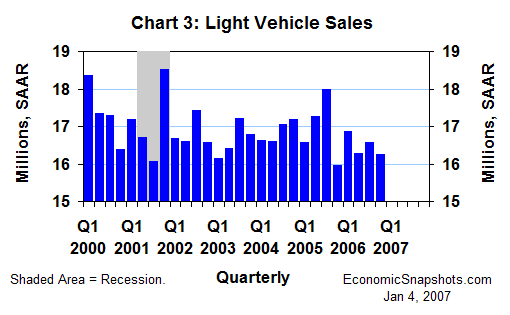
Compared to their Q3 average, light vehicle sales fell by about 0.3M units to about a 16.3M unit annual rate in Q4 (Chart 3). This relatively small decline should not play a major role in Q4 consumption growth.

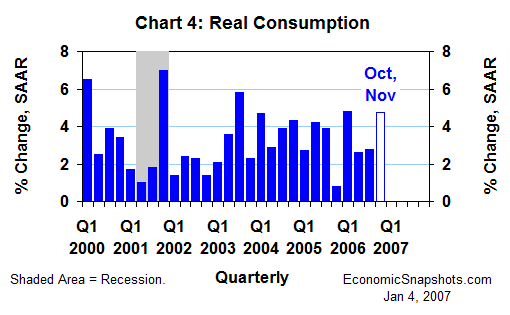
In fact, despite this weakening in Q4 light vehicle sales, the available monthly data (through November) show real consumption growth tracking at a hefty 4.8% annual rate for the first two months of Q4 (Chart 4). In Q3, real consumption rose at a 2.8% annual rate.

Suzanne Rizzo