
| Back to Index |
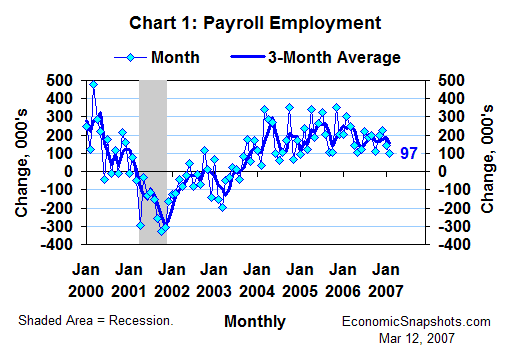
March 12, 2007 – U.S. payroll employment (released Friday) was essentially unchanged in February – edging up by 97K (Chart 1) after a revised 146K January gain (originally +111K). According to the BLS, it would have taken a February increase of at least 103.5K to qualify as statistically significant payroll growth at the 90% confidence level.
The BLS said weather-related volatility in construction hiring may have artificially depressed February payroll growth. Reflecting “adverse weather conditions in many parts of the country”, construction jobs plunged by 62K in February (Chart 2). Excluding the construction sector, February payrolls rose by 159K after a January increase of 118K.
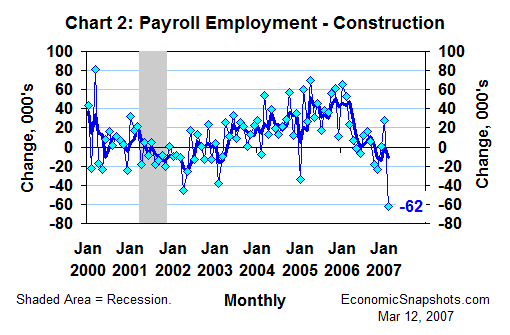
Construction payrolls have been on a slowing trend for about a year, but February’s decline was exceptional (the largest decline since January 1991, when construction payrolls fell by 75K). To the extent that it was weather driven, we should see a bounce back in construction jobs with the return of more normal weather.
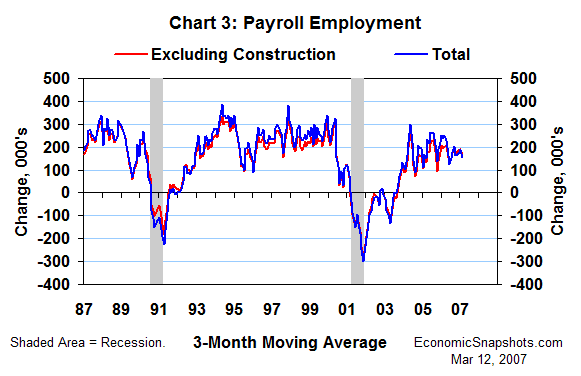
Payroll growth averaged 156K per month for the three months through January, or 167K per month excluding construction (Chart 3). With or without construction, this qualifies as a moderate trend in U.S. job growth – neither strong enough nor weak enough to provoke any changes in U.S. monetary policy.
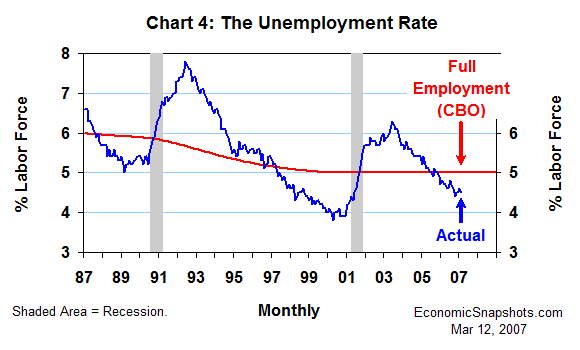
The unemployment rate was essentially unchanged in February, edging down by 0.1 percentage point to 4.5% after edging up by 0.1 percentage point the prior month (Chart 4). The unemployment rate has been essentially flat at about 4.5% for the last six months. That’s about a half percentage point less than the Congressional Budget Office’s 5% estimate of its “full employment” level, suggesting a relatively “tight” labor supply.
Average hourly earnings rose by 4.1% in February, compared to the same month last year. This twelve-month trend in earnings growth has been running at a historically high level of about 4% for the last eleven months (Chart 5).
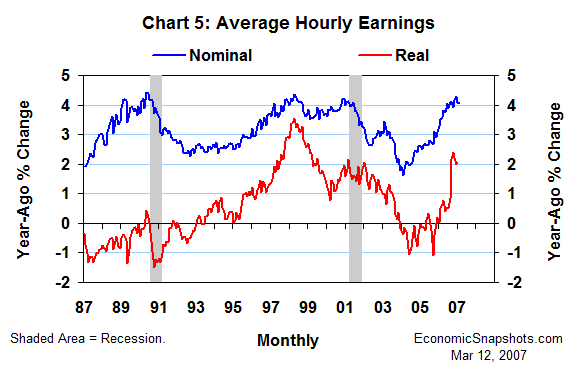
The continuing low unemployment rate and the continuing strong trend in average hourly earnings growth should help to keep FOMC members worried about the risks of a wage-price spiral. However, the FOMC has been counting on a “moderate” pace of real economic growth to gradually rein in these inflationary pressures. The relatively subdued trend in payroll job growth through February should reinforce that expectation.
Bottom line: These data support the outlook for no change in U.S. monetary policy.
Suzanne Rizzo