| Back to Index |
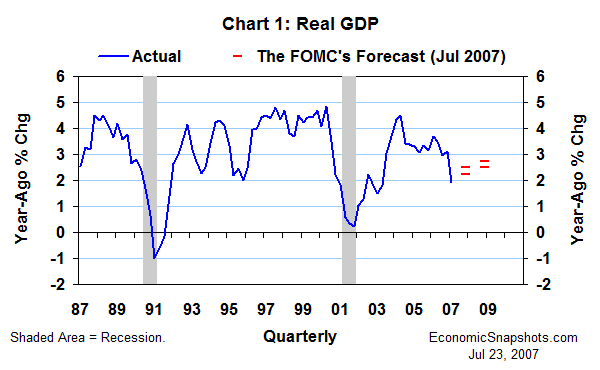
July 23, 2007 – U.S. real GDP rose by only 1.9% in the four quarters through Q1, slowing from a 3.7% gain for the same period last year (Chart 1). In his testimony to Congress last week, Fed Chairman Bernanke said this slowing was narrowly based in the housing sector.

Even if housing demand stabilizes as the FOMC expects, Bernanke said, construction will probably continue to fall as builders work to reduce their stocks of unsold new homes. However, the contribution of this inventory correction to real GDP growth should become less negative over time. Thus, given a steady trend of “moderate” growth in the rest of the economy, the FOMC anticipates a gradual firming in real GDP growth.
The FOMC’s consensus forecast calls for real GDP growth of 2.25% to 2.5% this year and 2.5% to 2.75% in 2008 (measured Q4 to Q4). This represents a downward revision compared to the FOMC’s February forecast of 2.5% to 3% real GDP growth this year and 2.75% to 3% in 2008. Bernanke blamed the change on weaker-than-expected residential construction activity in the data received since February.
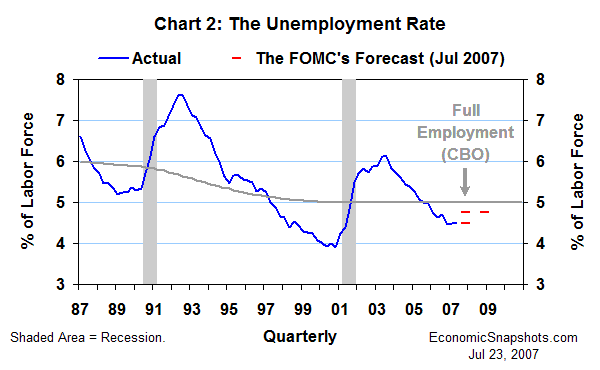
About in line with its February forecast, the FOMC expects the unemployment rate to edge higher, to average between 4.5% and 4.75% in Q4 this year and 4.75% in Q4 2008 (Chart 2). The unemployment rate was 4.5% in both Q1 and Q2.

The Congressional Budget Office estimates the “natural” (or “full-employment”) unemployment rate at 5%. Thus, the FOMC seems to be envisioning a relatively tight labor supply throughout the forecast horizon.
On the inflation front, Bernanke interpreted the large increases in food and energy prices this year as a source of future inflation risk. But, he argued, the less volatile “core” price growth (excluding food and energy prices) is a better measure of the economy’s “underlying” inflation trend.
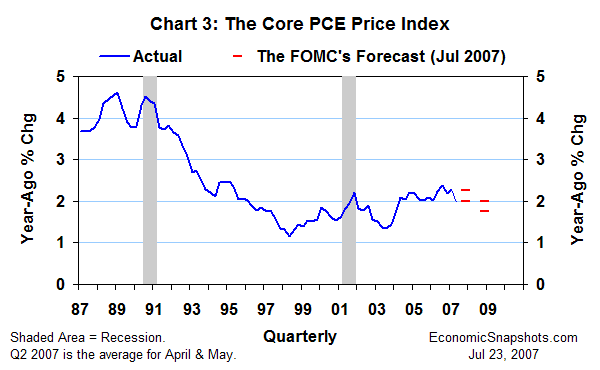
The core chained price index for personal consumption expenditures (the core PCE price index) rose by 2.3% in Q1, compared to the same quarter last year, and by 2% in the first two months of Q2 (Chart 3).

As in February, the FOMC forecasts 2% to 2.25% growth in the core PCE price index for all of this year (measured Q4 to Q4), and slightly slower growth of 1.75% to 2% in 2008.
Bernanke concluded his presentation of the FOMC’s forecast by reminding us, “With the level of resource utilization relatively high and with a sustained moderation in inflation pressures yet to be convincingly demonstrated, the FOMC has consistently stated that upside risks to inflation are its predominant policy concern.”
These inflation worries should keep the FOMC reluctant to ease U.S. monetary policy. At the same time, the prospects for a continuing, sluggish trend in real economic growth should keep the FOMC reluctant to tighten.
Bottom line: as long as the economy continues to evolve as the FOMC expects, the outlook will continue to favor a long stretch of unchanged U.S. monetary policy.
Suzanne Rizzo