
| Back to Index |
July 25, 2007 – U.S. real non-auto retail sales edged down by 0.4% in June, after edging up by 0.3% in May (Chart 1).
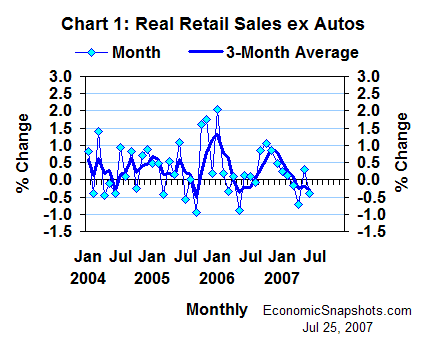
Adding in April’s 0.7% decline, real non-auto retail sales fell at a 2.9% annual rate for all of Q2, compared to their Q1 average (Chart 2). In Q1, these sales rose at a 3.4% annual rate.
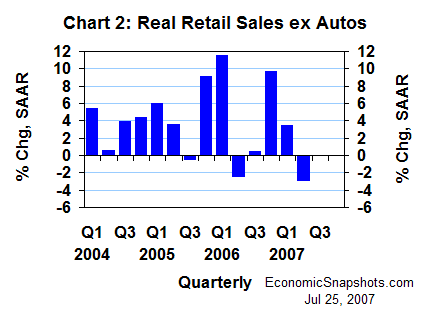
These data suggest that consumers’ real purchases of non-auto goods fell in both June and Q2.
Sales of non-auto goods account for nearly 36% of U.S. consumption. Consumption accounts, in turn, for slightly more than 70% of U.S. GDP.
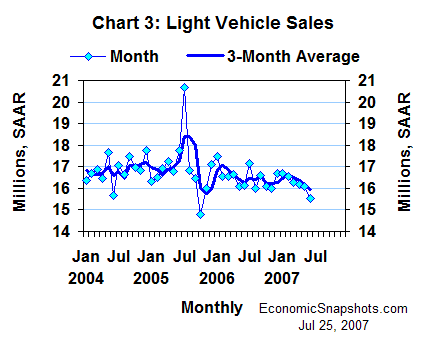
Reinforcing the weakness in non-auto goods, U.S. car and light truck sales fell by 0.6M units in June to a 15.5M unit annual rate (Chart 3). In percentage terms, June light vehicle sales fell by 3.5%. These sales were essentially unchanged in both April and May.
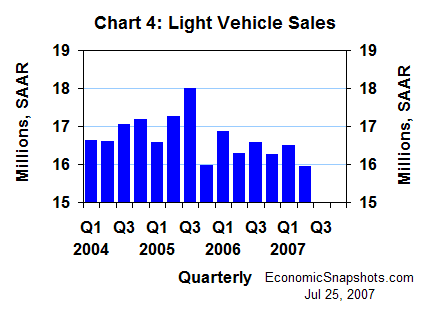
Compared to their Q1 average, light vehicle sales also fell by 0.6M units in Q2, to 15.9M units (Chart 4). This translates into a 13% quarterly decline, measured at an annual rate. In Q1, light vehicle sales rose by 0.2M (+6%, at an annual rate).
Altogether, sales of motor vehicles & parts are worth almost 5% of U.S. consumption. New car and truck sales account for about 56% of motor vehicles & parts.
Reflecting the ongoing volatility in household electricity & natural gas usage, consumers’ real services purchases edged down by 0.1% in May, after an unusually strong 0.6% April increase (Chart 5).
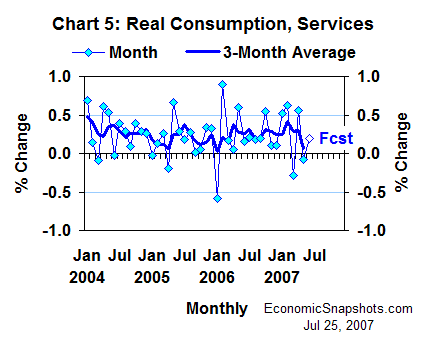
On average, real services spending rose by 0.2% per month in the first two months of Q2. A comparable June increase would put real services growth at about a 2.4% annual rate for all of Q2, compared to a 3.8% gain in Q1 (Chart 6).
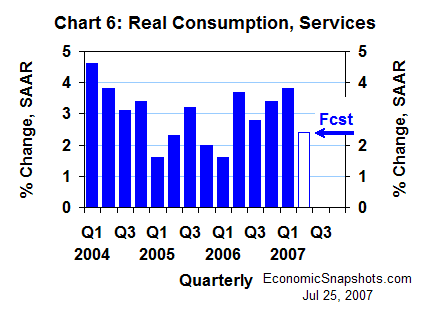
Spending on services makes up the balance of U.S. consumption – about 59%.
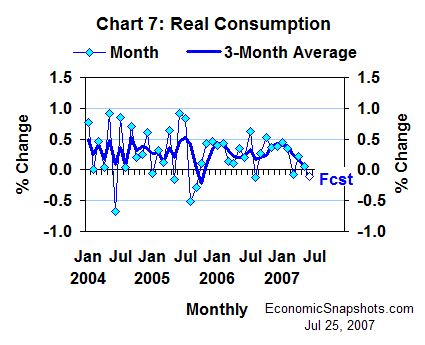
Putting these pieces together, real consumption may have edged down by 0.1% in June after edging up by 0.1% in May and 0.2% in April (Chart 7).
Then, in the quarterly cut, real consumption growth probably slowed to only about a 1.3% annual rate in Q2, compared to a much sturdier 4.2% gain in Q1 (Chart 8).
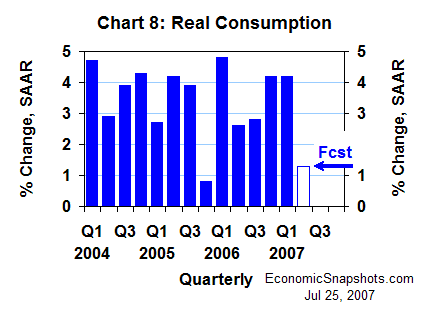
These estimates put real consumption growth at a 2.7% average annual rate for the first half of this year. Based on Fed Chairman Bernanke’s comments last week, a 2.7% consumption trend seems to be more or less consistent with the FOMC majority’s view of “sustainable” real economic growth.
To remain on this “sustainable” trend, however, consumption growth will have to strengthen in Q3.
Suzanne Rizzo