| Back to Index |
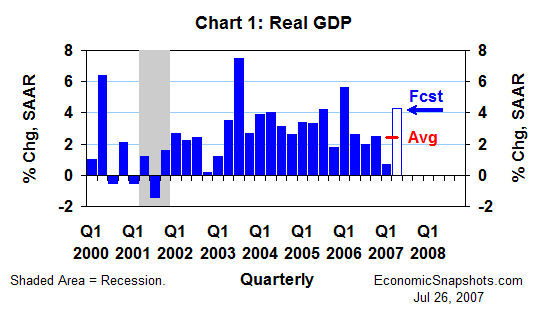
July 26, 2007 – Despite slower real consumption growth, it looks like real GDP (coming Friday) may have risen at an exceptionally strong 4.3% annual rate in Q2 (Chart 1).

But, coming behind Q1’s exceptionally weak 0.7% increase, this forecast implies only a “moderate” 2.5% average annual rate of real GDP growth in the first half of this year.
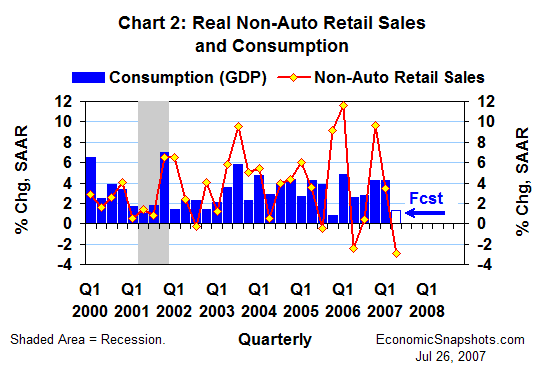
As discussed in an earlier report, real consumption probably rose by only about a 1.3% annual rate in Q2 after a much stronger 4.2% gain in Q1 (Chart 2).

In a nutshell: real non-auto retail sales fell at a 2.9% annual rate in Q2, compared to a 3.4% Q1 increase. Light vehicle sales also fell in Q2. And, the monthly data through May suggest softer Q2 growth in consumers’ real service purchases.
Consumers account for just over 70% of U.S. GDP, and the economy generally follows consumers’ lead. In Q2, however, stronger real growth in inventories, net exports and fixed investment should all join to drive real GDP growth higher.
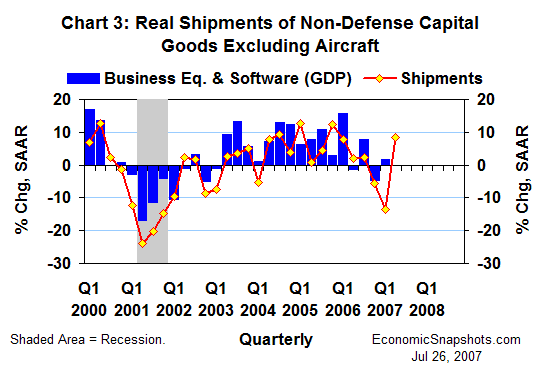
Real non-defense capital good shipments excluding aircraft rose at an 8.4% annual rate in Q2 after falling by 13.5% in Q1 (Chart 3).

These data point to stronger growth in real business fixed investment in equipment & software in Q2. In Q1, the latter edged up at a 1.7% annual rate.
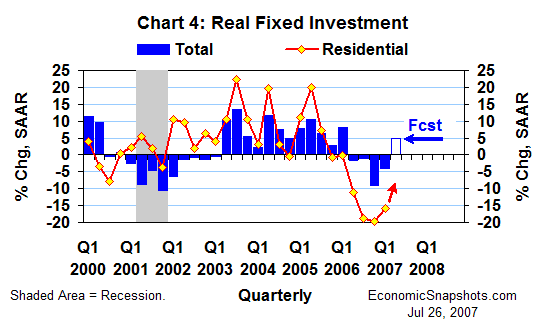
Based on monthly data through May, the rate of decline in real residential fixed investment (housing) might have roughly halved in Q2, compared to Q1’s huge 15.8% annual rate of decline (Chart 4).

Those same monthly data also suggest that growth in real business fixed investment in structures may have more than doubled in Q2, compared to Q1’s 4.8% annual rate of increase.
Thus, total real fixed investment (equipment & software plus housing and business structures) may have finally started to grow again in Q2 after four straight quarters of decline (see Chart 4). In Q1, real fixed investment fell at a 3.9% annual rate.
In Q1, a $23.6B drop in real net exports (measured in chained 2000 dollars) reduced real GDP growth by 0.8 percentage points. At the same time, a $26.6B falloff in real inventory investment reduced Q1 real GDP growth by an additional percentage point.
In the monthly data through May, both net exports and inventories appear to have reversed course in Q2. And, each seems likely to add about a percentage point to Q2 real GDP growth. Thus, net foreign demand and inventory building should account for roughly half of the total gain in Q2 real GDP.
Real government spending (always a wild card) rose at a below-trend 1% annual rate in Q1. This forecast assumes somewhat firmer government spending growth in Q2.
Finally, lending more than the usual amount of uncertainty to this particular GDP forecast, any of the last three years' data may be revised in Friday's data release, reflecting the BEA’s regular, annual benchmark revisions.
Suzanne Rizzo