
| Back to Index |
Aug 17, 2007 – U.S. car and light truck sales fell by 0.4M units in July to a 15.2M unit annual rate (Chart 1). That should have a small negative effect on July real consumption growth.
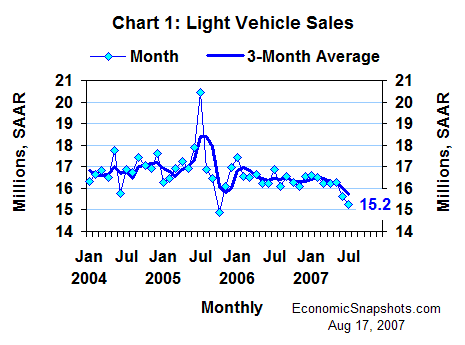
In June, light vehicle sales fell by 0.6M units, and consumers’ real purchases of motor vehicles & parts fell by 2.2%. The latter trimmed about 0.1 percentage points from real consumption growth in June. Motor vehicles & parts accounted for 4.6% of U.S. consumption in Q2.
Moving in the opposite direction from autos, real non-auto retail sales rose by 0.5% in July (Chart 2). In June, these sales fell by 0.2%.
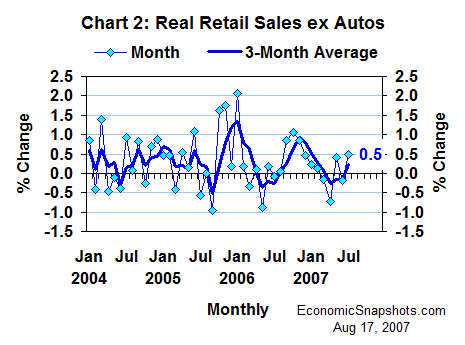
Even with July’s gain, the trend in real non-auto retail sales remained weak. Growth in these sales averaged just 0.2% per month for the three months through July.
As far as July consumption growth is concerned, the upturn in non-auto consumer goods should offset the downturn in light vehicle demand, with a small margin to spare. Non-auto consumer goods accounted for 35.7% of consumption in Q2. That’s about 8 times more weight than the auto sector.
Consumers’ real services purchases rose by 0.2% in June, after edging down by 0.1% in May (Chart 3). This forecast assumes another 0.2% increase in July.
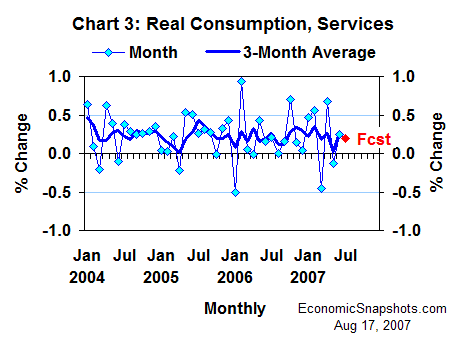
Services account for all of the rest of consumption. That was 59.7% in Q2.
Putting these pieces together, real consumption might have risen by 0.2% to 0.3% in July, compared to no change in June (Chart 4).
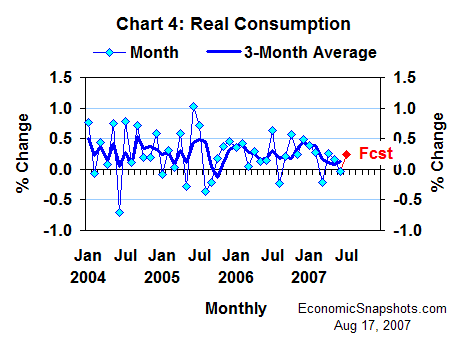
That would leave Q3 real consumption growth tracking at about a 2% annual rate, as of the quarter’s first month (Chart 5).
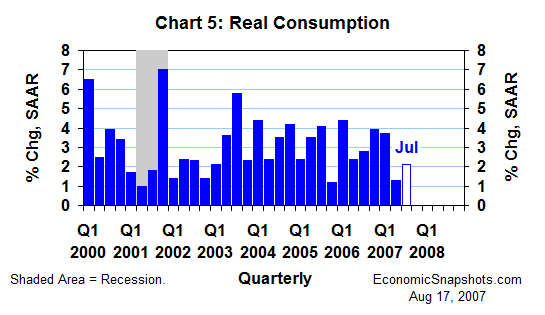
Real consumption rose at an unusually weak 1.3% annual rate in Q2. A 2% gain for all of Q3 would yield average growth of only about a 1.6% annual rate for Q2 and Q3. That’s not a big improvement.
Bottom line: the data to date suggest a continuing sluggish trend in real consumption growth in July.
Suzanne Rizzo