| Back to Index |
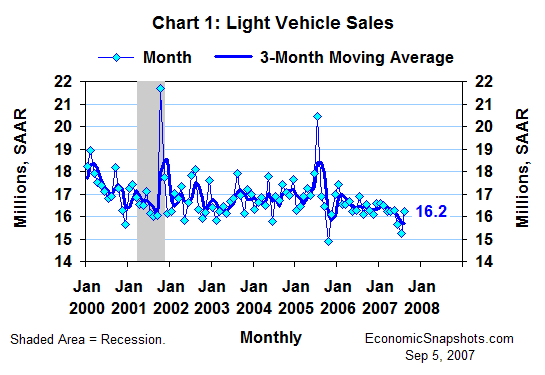
September 5, 2007 – U.S. car and light truck sales rose by about 1M units in August to an estimated 16.2M unit annual rate (Chart 1). That’s a plus in the outlook for August retail sales and consumption growth.

Light vehicle sales were unusually weak in both June and July. August’s unusually strong gain brought them back to the 16.1M to 16.6M unit range that had prevailed for the 10 months through May.
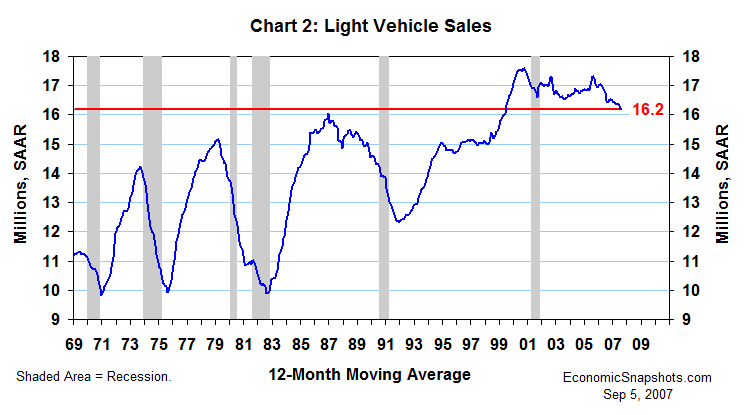
Light vehicle sales averaged about 16.2M units for the twelve months through August (Chart 2). That’s 0.2M units less than the same figure for August last year.

This twelve-month trend in light vehicle sales reached a peak of 17.3M units in July and August 2005. It has fallen by more than a million units, since then.
But, that’s old news. This trend has barely budged in the last twelve months – and August sales were right on trend.
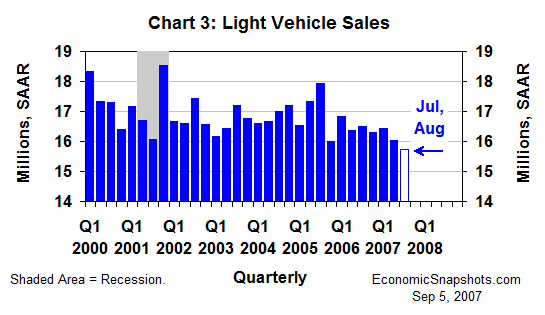
In the quarterly cut, light vehicles sales averaged about 15.7M units in July and August (Chart 3). That’s 0.3M units less than their 16M unit average for all of Q2.

Thus, despite some strong August growth, light vehicle sales were shaping up to have a small negative impact on Q3 real consumption growth, as of the quarter’s second month. Still, that is an improvement compared to last month, when these Q3 auto effects were looking more than twice as negative.
Suzanne Rizzo