
| Back to Index |
September 10, 2007 – In Friday’s data, U.S. payroll employment edged down by 4K in August, after edging up by 68K in July and by 69K in June (Chart 1).
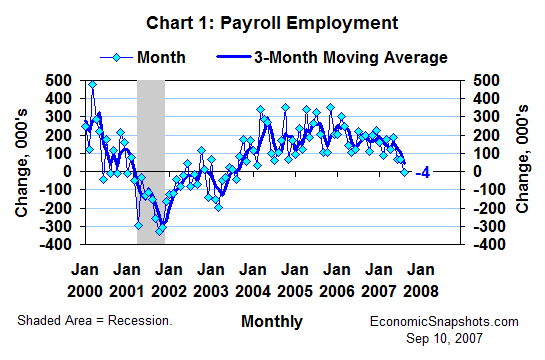
According to the BLS, it takes payroll growth of at least 103.5K to qualify as statistically significant at the 90% confidence level. These data now show three straight months of essentially zero growth in payroll jobs.
On average, payrolls rose by just 44K per month in the three months through August (Chart 2).
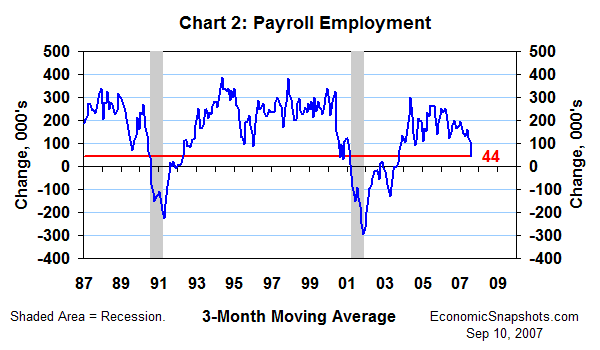
This three-month trend was 162K for the three months through May – almost four times stronger. And, for the three months through January it was 195K.
Both of the last two recessions were presaged by similar weakness in this three-month payroll trend. It slowed to 75K in February 2001 (two months before the start of the 2001 recession), and to 7K in March that year. It slowed to 40K in July 1990 (one month before the 1990-91 recession began).
The BLS said some of the recent weakness in payroll growth can be blamed on volatility in local government education jobs. The latter fell by 32K in August and by 50K in July.
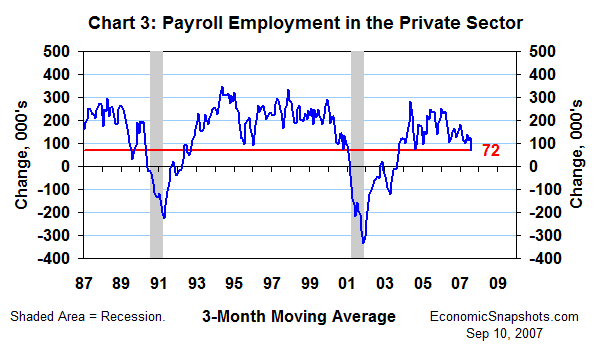
Thus, the pattern of growth in private payrolls (which exclude all government jobs) may be more representative of what is really going on.
Private payrolls edged up by 24K in August after a more substantive 120K gain in July. (For private payrolls, the minimum significant monthly increase is 96.1K.)
Private payrolls rose by an average of 72K per month for the three months through August (Chart 3). That’s only about half as much growth as their 141K trend for the three months through May. And, for the three months through January, private payroll growth averaged 181K.
The one-month payroll diffusion index fell by 6.1 index points to a 3½ year low of 51.3 in August (Chart 4). This suggests that August’s slowing private payroll growth was broadly based.
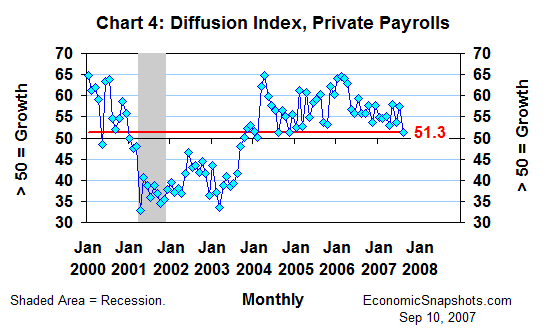
The August diffusion index level suggests a weak, but still positive trend in these jobs.
The unemployment rate was unchanged at a relatively low 4.6% in August (Chart 5).
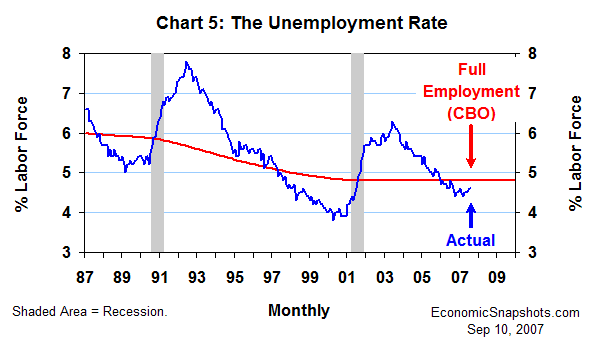
According to the Congressional Budget Office’s revised August estimates, the unemployment rate’s “full employment” level is currently 4.8%. That’s 0.2 percentage points higher than the actual unemployment rate in July and August, suggesting that the U.S. labor supply remained a bit too “tight” through August.
The unemployment rate has been steady in a narrow range of 4.4% to 4.6% for the last 12 months. However, a low unemployment rate won’t fend off a recession if the economy stops creating new jobs.
Bottom line: These data do not provide compelling evidence that the economy is currently falling into a recession. But, they might be weak enough to convince the reluctant FOMC to take some “precautionary” easing action at its monetary policy meeting this month. That seems to be what most (if not all) Fed watchers currently expect.
Suzanne Rizzo