
| Back to Index |
September 26, 2007 – U.S. retail sales excluding autos fell by 0.4% in August, but the prices of consumer goods fell by an even steeper 0.5%. Thus, real non-auto retail sales edged up by 0.2% in August after rising by 0.7% in July (Chart 1). That’s a small plus for August real consumption growth.
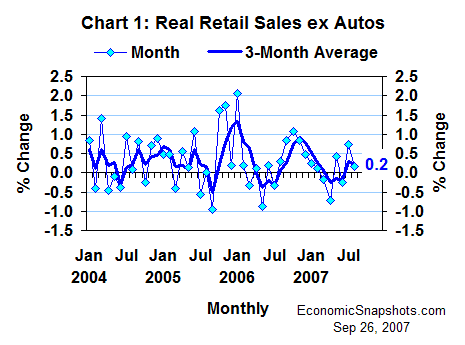
As of August, real non-auto retail sales were tracking at a 4% annual rate in Q3, compared to their Q2 average. That sounds like good sturdy growth. But, these sales fell at a 2.4% annual rate in Q2. Thus, the data to date show little net progress in real non-auto retail sales over the last two quarters.
According to the BEA’s final tally, U.S. car and light truck sales surged by 1M units in August to a 16.2M unit annual rate – recovering their May level after two months of decline (Chart 2). This increase suggests a large positive contribution to real consumption growth from the auto sector in August.
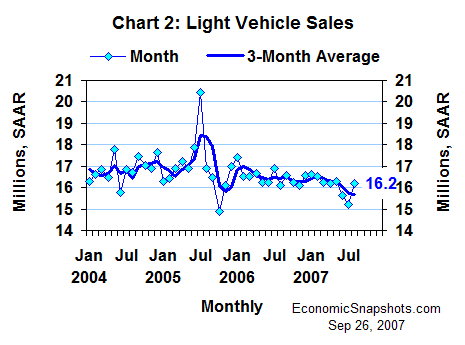
However, for the first two months of Q3, light vehicle sales were still running 0.3M below their Q2 average. Thus, the auto sector still looks like a (slightly) negative force in Q3 real consumption growth.
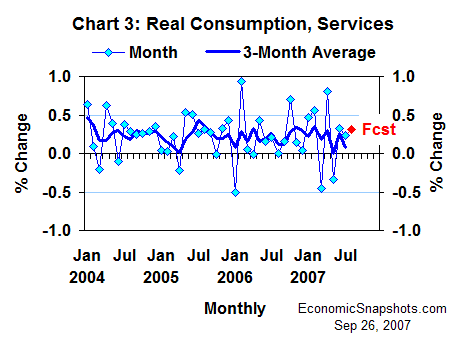
Consumers’ real services purchases rose by 0.2% in July and by 0.3% in June (Chart 3). The estimates here assume a comparable August services gain.
Putting these pieces together, real consumption growth might reach 0.6% in August (propelled by the auto sector) after rising by 0.3% in July (Chart 4).
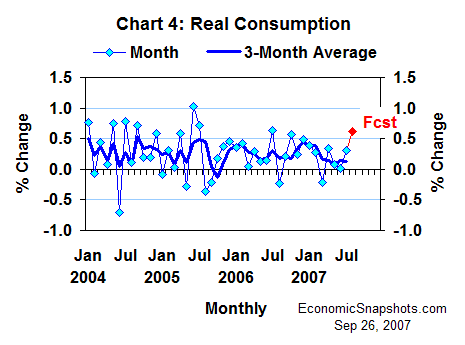
That would leave Q3 real consumption growth tracking at about a 3.7% annual rate, as of the quarter’s second month (Chart 5).
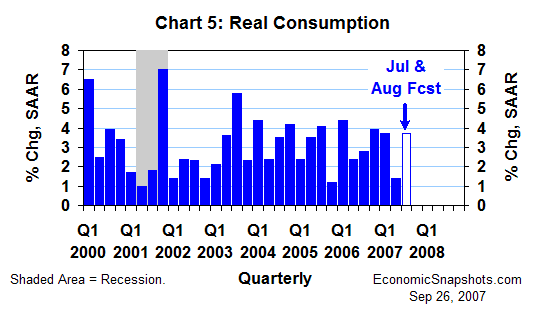
Real consumption rose at a meager 1.4% annual rate in Q2, according to the BEA’s second (preliminary) quarterly estimates. (The final Q2 data are coming in Thursday’s GDP release.) Thus, a 3.7% increase for all of Q3 would yield a moderate average quarterly gain of about 2.5% for the last two quarters.
Suzanne Rizzo