| Back to Index |
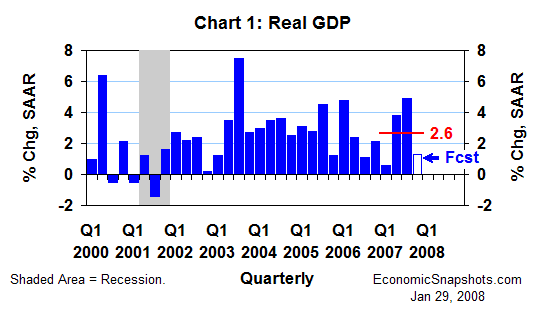
January 29, 2008 – U.S. real GDP (coming Wednesday) probably rose by only about a 1.3% annual rate in Q4 after a much stronger 4.9% gain in Q3 (Chart 1).

This forecast implies a 2.6% average annual rate of real GDP growth for all four quarters last year. That’s slightly stronger than the FOMC’s October forecast of 2.4% to 2.5%.
In Q4, inventories and net exports should account for nearly two thirds of the slowing in real GDP growth, compared to Q3. This forecast also includes slower real consumption and government spending growth in Q4.
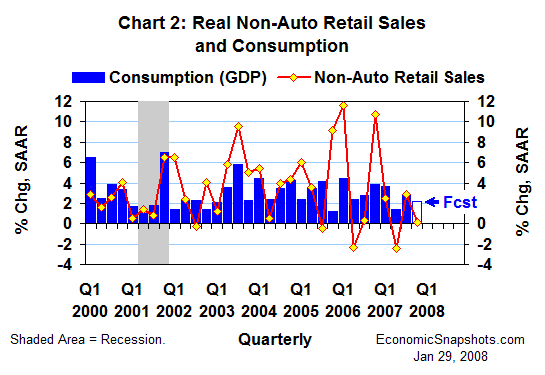
Real consumption probably rose at about a 2.2% annual rate in Q4 after a 2.8% gain in Q3 (Chart 2).

Light vehicle sales firmed a bit in Q4, edging up by 0.3M units to a 16.1M unit annual rate. (In Q3, these sales fell by 0.2M.) But, real non-auto retail sales growth slowed by 2.8 percentage points to a mere 0.1% annual rate in Q4. And, based on two months’ data, Q4 growth in consumers’ real services purchases may have slowed by about a half percentage point, to an annual rate of about 2.3%.
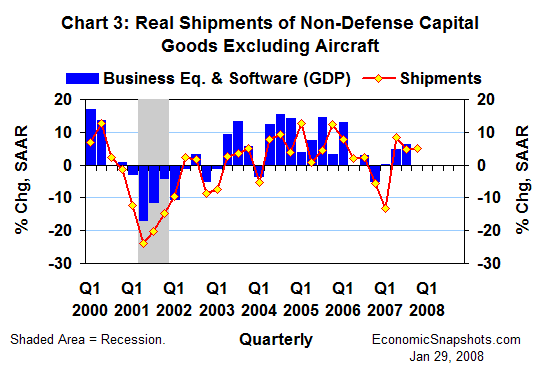
Beyond consumption, real shipments of non-defense capital goods excluding aircraft rose at a 5% annual rate in Q4 – roughly in line with their 4.6% Q3 gain (Chart 3). These data suggest that Q4 growth in businesses’ real fixed investment in equipment & software might have roughly matched Q3’s 6.2% annual rate.

As of November, Q4 growth in real non-residential construction spending was also on track to roughly match (or exceed) Q3’s huge 16.4% annual rate.
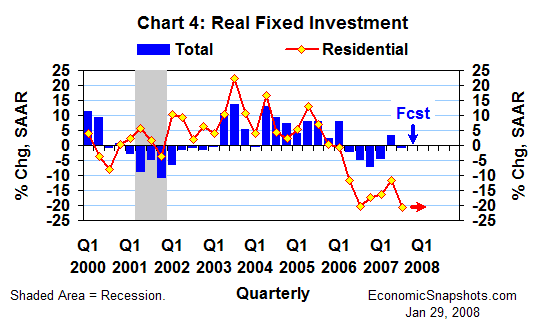
But, real residential construction spending (housing) plunged at a 20.5% annual rate in Q3. And, data through November suggest that it continued to fall at a similar rate in Q4.
Weighed down by this landslide in the housing sector, total real fixed investment was probably about unchanged in Q4 after edging down at a 0.7% annual rate in Q3 (Chart 4).

In Q3, strong real gains in both inventory investment and net exports added a total of 2.3 percentage points to real GDP growth. Monthly data through November suggest little or no real change in either of these GDP components in Q4. Thus, their joint contribution to real GDP growth seems to have fallen by about 2.3 percentage points (to about zero) in Q4.
Real government spending rose at an above-trend 3.8% annual rate in Q3. This forecast assumes weaker real government growth in Q4.
Suzanne Rizzo