| Back to Index |
February 26, 2008 – In data released earlier this month, U.S. retail sales excluding autos rose by 0.3% in January. But, according to last week’s CPI release, January prices of consumer goods rose by 0.5%.
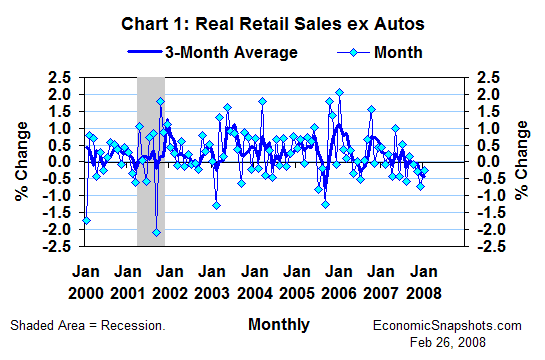
Thus, real non-auto retail sales fell by 0.2% in January, after a 0.7% December decline (Chart 1). These real sales have fallen in five of the last six months.

Non-auto retail sales are an indicator of consumer demand for non-auto goods. The latter is worth about 36% of U.S. consumption, and about 25% of U.S. GDP. For context, the infamous housing sector’s GDP weight (the GDP weight of residential fixed investment) is only about 4%.
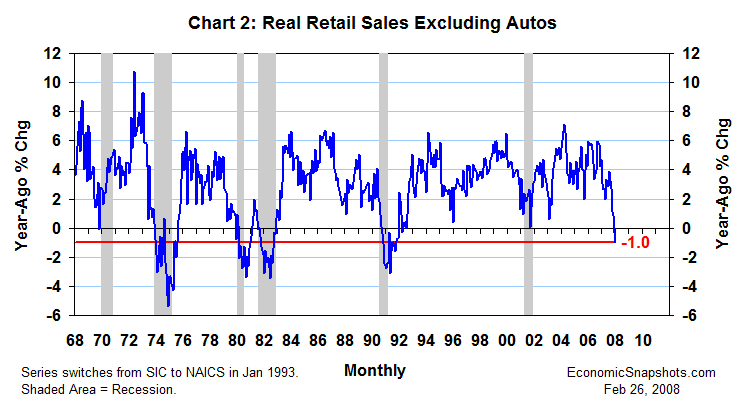
Compared to the same month last year, real non-auto retail sales fell by 1% in January (Chart 2).

In data dating back to January 1968, we have never seen such a weak twelve-month trend in real non-auto retail sales except when the economy was already in a recession, or just climbing out of one.
Bottom line: these data look like a recession.
Suzanne Rizzo