| Back to Index |
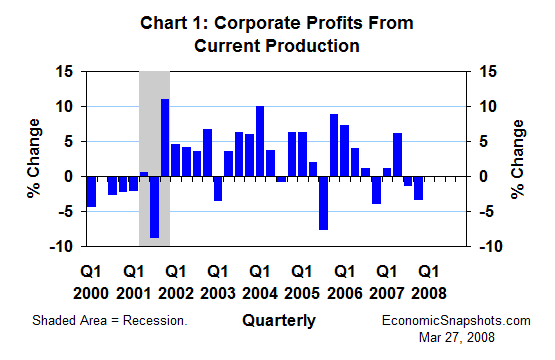
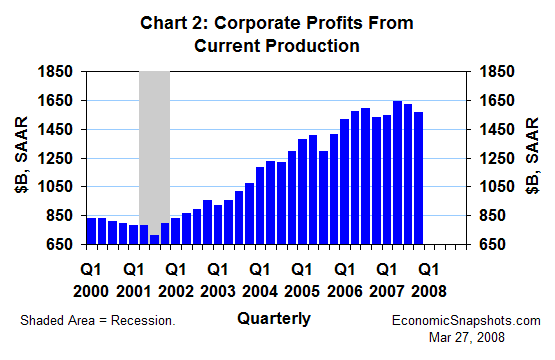
March 27, 2008 – U.S. corporate profits from current production fell by 3.3% in Q4 (not an annual rate) after falling by 1.2% in Q3 (Charts 1 and 2).


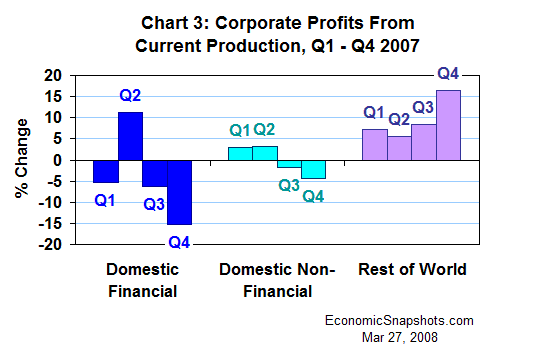
Moving counter to the total, net foreign profit receipts soared by 16.4% in Q4 after a big 8.4% gain in Q3. But, this improvement was out-weighed by the deepening falloff in domestic profits (Chart 3).

Financial corporations’ domestic profits fell by 15.2% in Q4 after falling by 6.2% in Q3. And, domestic non-financial profits fell by 4.3% in Q4 after a Q3 decline of 1.8%.
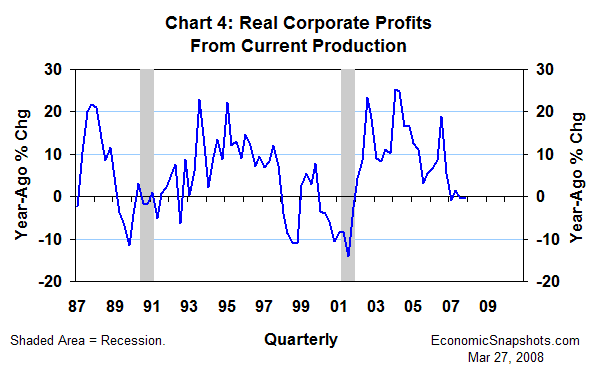
Corporate profits from current production rose by 2.5% in Q4, compared to the same quarter last year. The GDP price index rose by 2.6% during this same time frame. Thus, real profits were only about flat, on average, for the four quarters through Q4 (Chart 4).

U.S. corporations enjoyed a five-year run of very strong profit growth from 2002 through 2006. That boom clearly fizzled out last year.
Nevertheless, profit levels remained relatively high through Q4. We have yet to see the massive real profit declines that characterized the last recession in 2001.
Suzanne Rizzo