| Back to Index |
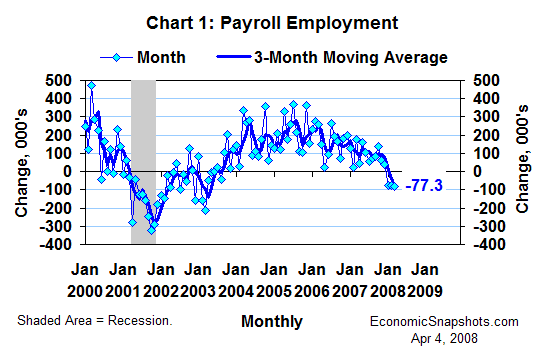
April 4, 2008 – U.S. payroll employment edged down by 80K in March (Chart 1). This followed revised declines of 76K in both of the prior two months. Revisions reduced the prior two months’ payroll growth by a total of 67K.

According to the BLS, it takes a one-month change in total payrolls of at least ±104K to qualify as statistically significant at the 90% confidence level. Payrolls were essentially unchanged in each of the last three months.
But, the minimum significant three-month change is ±150.5K. (For the three-month moving average, that’s about ±50K.) The cumulative 232K payroll decline seen in the last three months adds up to some real job losses.
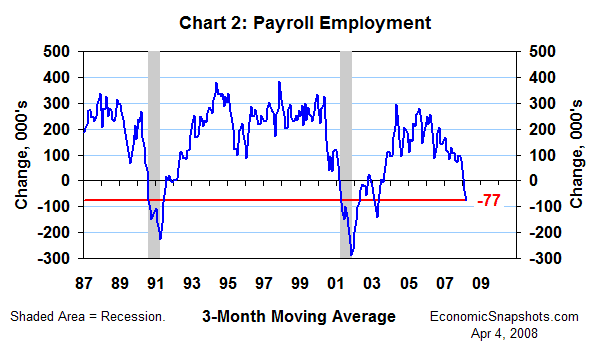
For the three months through March, payrolls fell by an average of 77K per month (Chart 2). That compares to an average gain of 80K per month for the three months through December last year.

Thus, the economy downshifted from a trend of weak job growth in Q4 to a trend of slow decline in Q1. The “next” recession may have snuck through the door in January, along with the New Year.
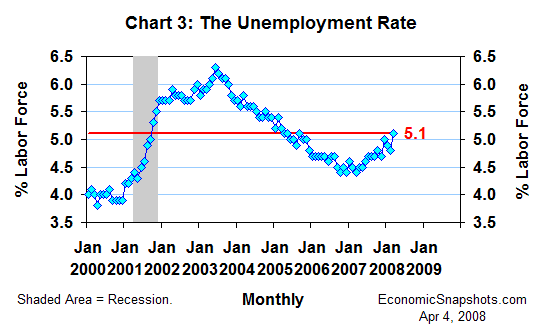
The unemployment rate rose by 0.3 percentage points to 5.1% in March (Chart 3). That’s little changed from December, when the unemployment rate was 5%. In March last year, however, the unemployment rate was 0.7 percentage points lower at 4.4%.

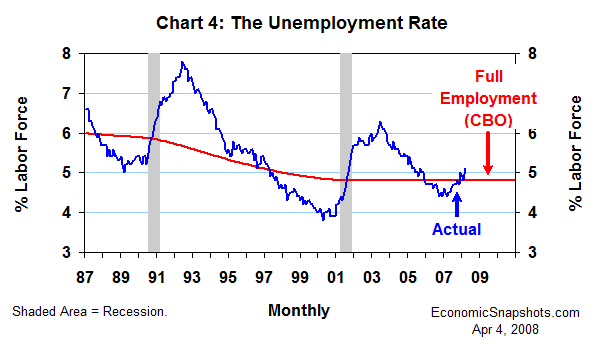
As of March, the unemployment rate exceeded the Congressional Budget Office’s 4.8% estimate of its “full-employment” level by 0.3 percentage points (Chart 4).

If the recession did start in January, it was off to a relatively mild start – at least for these first 3 months.
If the recession did start in January, the downturn should continue to deepen. There were 10 recessions in the last 60 years, and they lasted for 10 months, on average. Both of the last two recessions were 8 months long.
Suzanne Rizzo