| Back to Index |
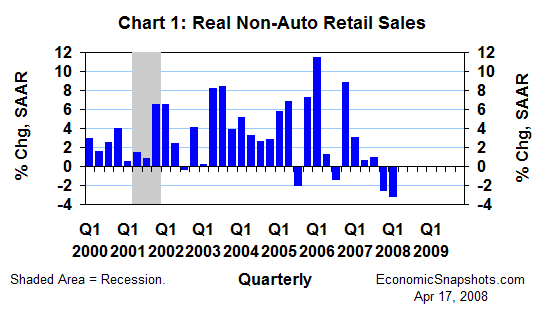
April 17, 2008 – U.S. real non-auto retail sales fell at a 3.2% annual rate in Q1, compared to their Q4 average (Chart 1). That followed a 2.5% drop in Q4. The last time these sales fell for two straight quarters was in Q3 and Q4 1991.

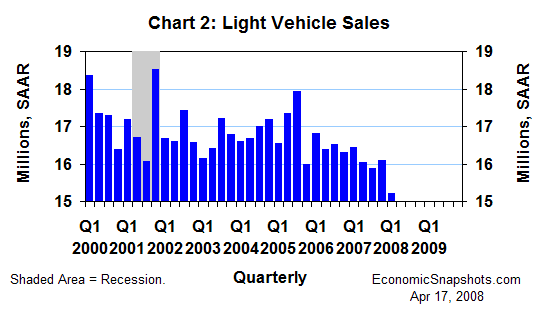
Car and light truck sales averaged a 15.2M unit annual rate in Q1, down from 16.1M in Q4 (Chart 2). In Q1, light vehicle sales reached their lowest quarterly level since 14.8M in Q3 1998.

With these declines in both auto and non-auto sales, the real demand for consumer goods (as measured in the GDP accounts) almost certainly fell in Q1. In Q4, consumers’ real good purchases rose at a 1.4% annual rate.
In the less volatile consumer services sector, real spending rose at a 3.5% annual rate in the first two months of Q1 (compared to its Q4 average). This forecast assumes similar growth for Q1 as a whole. In Q4, these sales rose at a 2.8% annual rate.
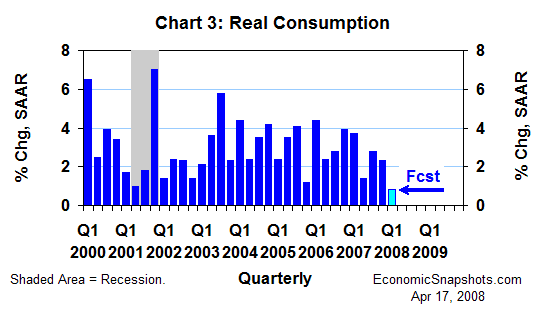
Putting these pieces together, real consumption growth probably slowed to only about a 0.8% annual rate in Q1 (Chart 3). That would be about 1.5 percentage points less growth than Q4’s 2.3% gain.

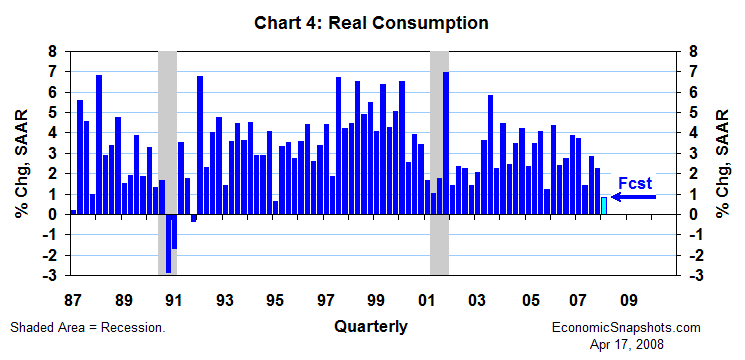
A 0.8% real increase in Q1 consumption would qualify as the weakest quarterly showing since a 0.6% rise in Q1 1995 (Chart 4). In Q2 2001 – at the start of the last recession – real consumption rose at a 1% annual rate.

Consumption accounts for roughly 70% of U.S. GDP. Thus, all else the same, a 1.5 percentage point slowing in Q1 real consumption growth would trim Q1 real GDP growth by about a percentage point.
Suzanne Rizzo