| Back to Index |
June 22, 2008 – In data released earlier this month, U.S. retail sales excluding autos rose by a brisk 1.2% in May. At the same time, revisions doubled growth in both of the prior two months: from 0.5% to 1% in April and from 0.4% to 0.8% in March.
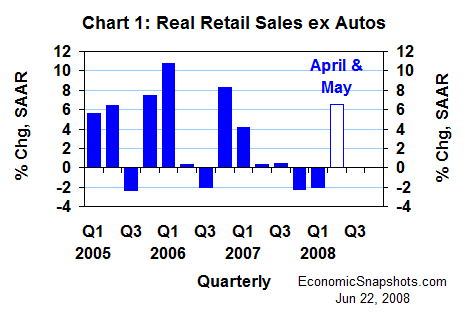
In May, rising inflation ate up most of this nominal growth. The CPI for consumer goods soared by 0.9% in May after edging up by just 0.1% in April. Thus, real non-auto retail sales growth slowed to 0.3% in May after a big 0.9% April gain (originally +0.4%).
Despite May’s slowing, these real sales are shaping up for a much stronger Q2. Compared to their Q1 average, real non-auto retail sales rose at a 6.6% annual rate in April and May (Chart 1). For all of Q1, they fell at a 2.1% annual rate.

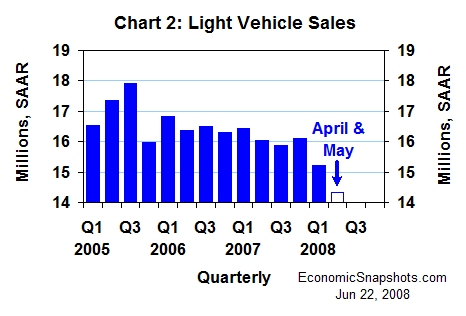
In contrast, car and light truck sales remained depressed in May – edging down by 0.2M units to a 14.2M unit annual rate. This followed an April decline of 0.6M.
These light vehicle sales averaged 14.3M units in the first two months of Q2 (Chart 2). That’s down from 15.2M for all of Q1 and 16.1M in Q4.

In Q1, total sales of motor vehicles & parts accounted for about 4% of U.S. consumption, compared to about 36% for non-auto consumer goods. Consumer demand for services contributed the remaining 60%.
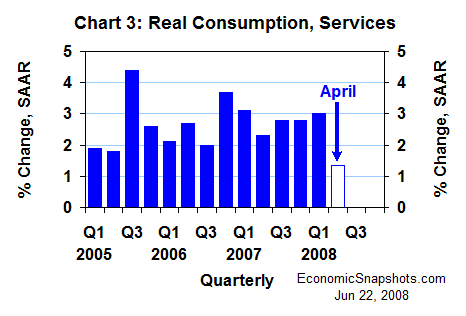
Real consumption of services rose at a reasonably strong 3% annual rate in Q1. But, the underlying trend has slowed in recent months. Growth averaged just 0.1% per month in the three months through April, and April growth was also 0.1%.
That left Q2 real consumer services growth tracking at only about a 1% to 1.5% annual rate, as of the quarter’s first month (Chart 3). The estimates here assume a similar (slower) services trend for all of Q2.

Putting these pieces together, real consumption might have risen by 0.1% or 0.2% in May. (The actual May data are coming on Friday.)
Further, reflecting the upward revisions in non-auto retail sales, April real consumption growth (originally zero) is likely to be revised higher. The guess used here for revised April growth is +0.2%.
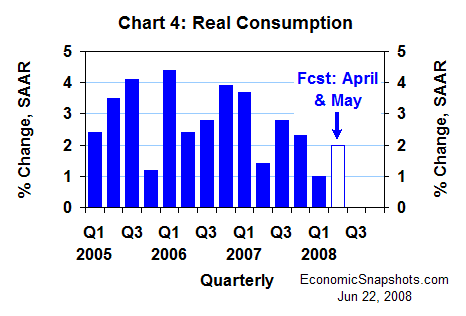
These monthly results would leave real consumption growth tracking at about a 2% annual rate for the first two months of Q2 (Chart 4). That would be twice as much growth as Q1’s meager 1% increase, but still fairly weak.

Consumption growth has been widely expected to strengthen in Q2 and Q3, as more and more consumers receive their Economic Stimulus checks. These special, one-time Federal income tax rebates are being mailed out in weekly batches, from April 28 through mid July.
Altogether, the government expects to pay $106.7B in rebates to individuals this year. That’s enough to add about one percentage point to this year’s disposable personal income growth, measured Q4 to Q4.
However, with other negative developments working against this government stimulus (such as job losses and the damage to consumers’ purchasing power caused by higher food and energy prices), the net outcome for real consumption growth might disappoint.
Suzanne Rizzo