| Back to Index |
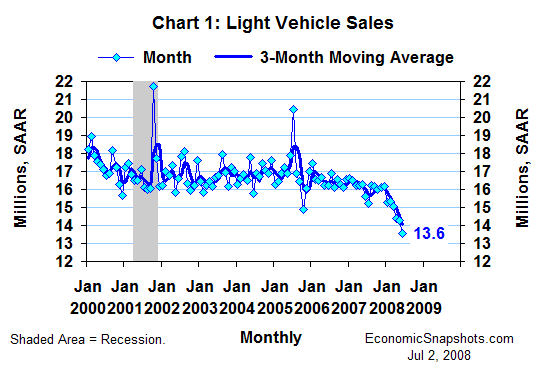
July 2, 2008 – U.S. car and light truck sales fell by 0.7M units in June to a 13.6M unit annual rate (Chart 1). That’s a negative for June’s real consumption growth.

These light vehicle sales were only about flat in May, but they have been on a declining trend since the start of this year.
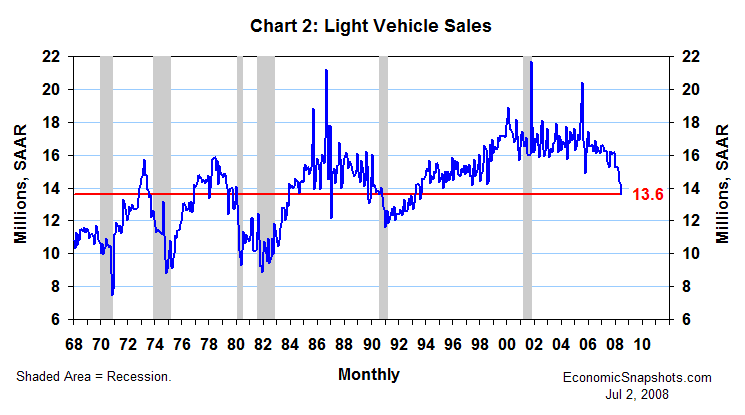
Light vehicle sales reached a 15-year low in June – their weakest since August 1993 (Chart 2).

There’s still some doubt about whether the economy actually fell into a recession this year. But, it certainly looks like a recession in the light vehicle market.
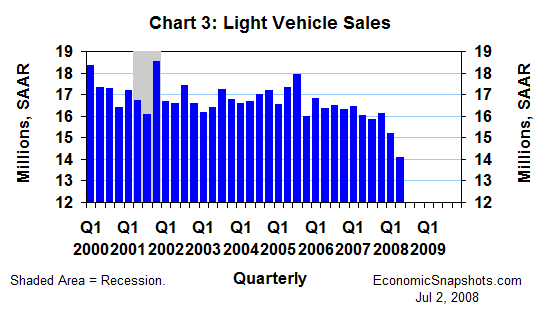
Light vehicle sales averaged 14.1M units for all of Q2 (Chart 3). That’s a decline of 1.1M units compared to Q1. In Q1, these sales fell by 0.9M units.

In Q1, a 13.4% annual rate of decline in consumers’ real purchases of motor vehicles & parts reduced real consumption growth by 0.6 percentage points. These data suggest a similar drag from the auto sector in Q2 consumption growth.
However, real non-auto consumer sales have been running somewhat stronger in the first two months of Q2. Thus, there’s hope for stronger real consumption growth for Q2 as a whole.
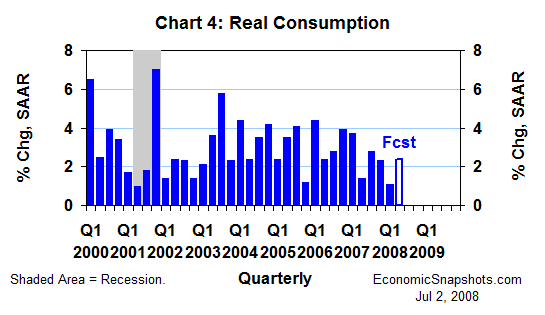
In Q1, real consumption rose at a weak 1.1% annual rate, according to the BEA’s final quarterly tally (Chart 4). The data to date would be consistent with Q2 growth of 2% to 2.5%.

This Q2 consumption forecast might change later this month, depending on the outcome for June non-auto retail sales.
Suzanne Rizzo